
Stem-and-Leaf Plots, Box Plots, and Outliers from Random Data
Loading the math board and drawing, please wait…
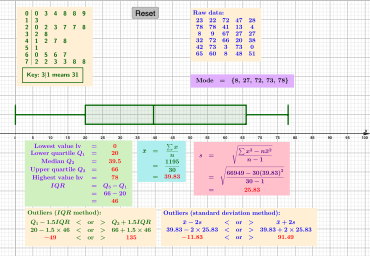
This example demonstrates how to generate a dataset (via randomness) and then construct both a stem-and-leaf plot and a box plot, highlighting potential outliers to compare data spread and central tendency. Key concepts include the five-number summary (minimum, Q1, median, Q3, maximum), the interquartile range IQR = Q3 − Q1, and the outlier criterion based on 1.5·IQR (commonly used to flag unusually small/large observations). Construction-wise, the workflow is: generate data with Random, sort it with Sort, compute Min, Q1, Median, Q3, and Max, then build the stem-and-leaf representation with StemPlot and the box-and-whisker visualization with BoxPlot. The construction also references Mode and Sum for additional summary/feature display. It uses objects such as the data list (l1) and UI/annotation elements (e.g., button1, text1, and auxiliary labeled objects like a,b,c,… and A1…A29) to manage and render the plots. Suitable for middle/high school statistics, descriptive data analysis lessons, and classroom demonstrations of quartiles and outlier interpretation.
GeoGebra Commands & Parameters
Random(0, 80, 30) → l1, {23, 22, 72, 47, 28, 78, 78, 41, 13, 4, 8, 9, 67, 27, 27, 32, 72, 66, 20, 38, 42, 73, 3, 73, 0, 65, 60, 8, 48, 51}StemPlot(l1) → text1Min(l1) → aQ1(l1) → bMedian(l1) → cQ3(l1) → dMax(l1) → eBoxPlot(1, 0.5, l1, true) → fSum(l1) → gSum(l1^(2)) → hMode(l1) → l2Sort(l1) → l3
AI Drawing Prompt Reference
Please draw a statistical data graph with a stem-and-leaf plot and a box plot. The data is generated randomly and includes key statistics such as minimum, first quartile, median, third quartile, and maximum. The graph should show data distribution and highlight potential outliers. The construction order is: generate random data, calculate statistics, draw the stem-and-leaf plot and box plot, and add annotations for sum and average.
The prompt above was compiled from the original drawing commands and is for reference only.