
Standard Score Demonstration
Loading the math board and drawing, please wait…
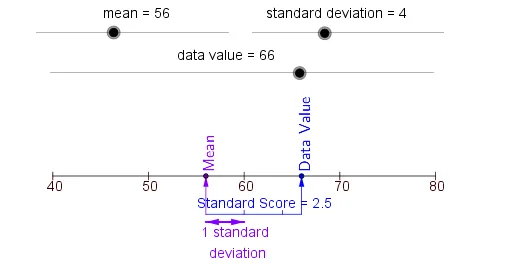
This example demonstrates the concept of standard score. It involves key statistical concepts such as mean and standard deviation. Using GeoGebra commands like If, Segment, Sequence, etc., it visually illustrates the process of data standardization. Suitable for high school and above students to learn probability and data analysis.
GeoGebra Commands & Parameters
If(seed < GMn, -1, 1) → SgnSegment(LftEnd, RgtEnd) → LineSequence(AF(k), k, LftVl, RgtVl, 10) → TcVlSqCountIf(x > 0, TcVlSq) → TkCntSequence(Segment[(Element[TcVlSq, k], Hgt - 0.1), (Element[TcVlSq, k], Hgt + 0.1)], k, 1, TkCnt) → TcSqVector(MnTl, MnHd) → MnPtrVector(DVTl, DataValue) → DVPtrSegment(MnTl, DVTl) → PtrSgSequence(Text[LftVl + ((k - 1) * 10), (Element[TcVlSq, k] - 0.15, Hgt - 0.4)], k, 1, TkCnt) → AxLbVerticalText("Data Value", DVLP) → DVLblVerticalText("Mean", MnLP) → MnLbl_1Sequence(Segment[(GMn + ((Sgn * k) * GSD), Hgt - 0.9), (GMn + ((Sgn * k) * GSD), Hgt - 1)], k, 1, TkNm) → PtrTSqVector(SDP1, SDP2) → SDSgRtVector(SDP2, SDP1) → SDSgLf