
Standard Form Linear Inequalities Quiz
Loading the math board and drawing, please wait…
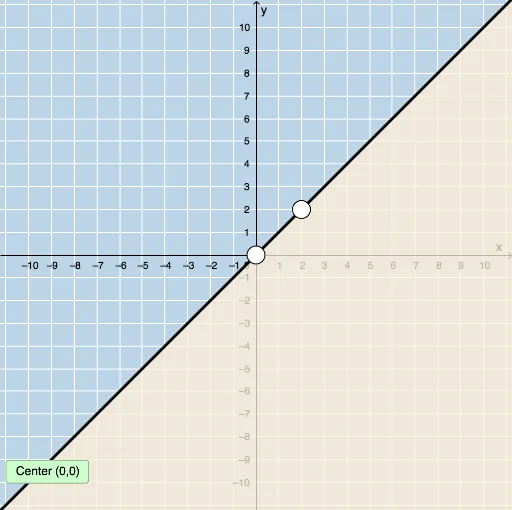
This interactive GeoGebra resource demonstrates how to graph linear inequalities in two variables on the coordinate plane and provides a quiz with instant feedback to assess student understanding. Key mathematical concepts covered include: graphing linear functions, representing solution sets of linear inequalities, and understanding the relationship between boundary lines and shaded regions. Construction details: Random command generates random inequality coefficients (a, b, c), Line command plots boundary lines, Slope command calculates line slopes, Sequence and Union create question banks, while text objects display questions and feedback. This resource is ideal for middle school mathematics teachers teaching inequality units, suitable for classroom practice or homework assignments to help students master graphing standard form Ax+By>C inequalities.
GeoGebra Commands & Parameters
Random(-10, 10) → aRandom(-5, 5) → kSequence(i, i, 1, 10, 1) → brightSequence(i, i, -10, -1, 1) → bleftUnion(bleft, bright) → blistRandomElement(blist) → bRandom(1, 4) → nLine(A, B) → jLine(A, B) → lSlope(j) → p
AI Drawing Prompt Reference
Draw a standard form linear inequality Ax+By>C, where A and B are randomly generated integers in the ranges -10 to 10 and -5 to 5, respectively. First, draw the boundary line, then determine the shaded area based on the line's slope. Generate 10 different B values, including positive and negative, and randomly select one as the B value. Draw the inequality's graph using the selected B value and a randomly generated C value, and display its slope.
The prompt above was compiled from the original drawing commands and is for reference only.