
Graphing Linear Inequalities by Dylan Coster
Loading the math board and drawing, please wait…
In collections
Graphing Linear Inequalities Book
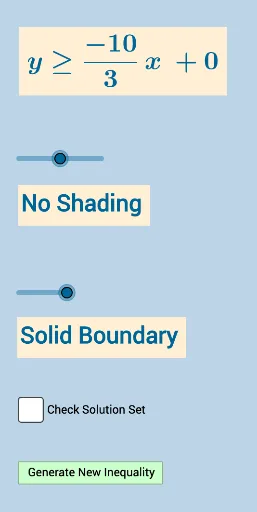
This example demonstrates how to plot linear inequalities in two variables. Key mathematical concepts include linear inequalities, coordinate systems, and region representation. Construction involves GeoGebra commands such as Sequence, Union, Random, Line, and FractionText. Suitable for middle or high school mathematics education to understand solution sets and graphical relationships.
GeoGebra Commands & Parameters
Sequence(i, i, -10, -1) → aSequence(i, i, -10, -1) → bSequence(i, i, 1, 10) → cUnion(b, c) → dRandom(-10, 10) → eLine(A, B) → iFractionText(Slope[f]) → text1FractionText(f(0)) → text2Random(1, 4) → symbolLine(A, B) → hSlope(i) → slope_i
AI Drawing Prompt Reference
Plot linear inequalities in a 2D coordinate system, showing key point sequences and randomly generated lines with slope and intercept text annotations, combining key points via union operations, and using different symbols to represent inequality regions, ultimately presenting the solution sets and graphical relationships of linear inequalities.
The prompt above was compiled from the original drawing commands and is for reference only.