
Graphing Standard Form Linear Inequalities (Quiz)
Loading the math board and drawing, please wait…
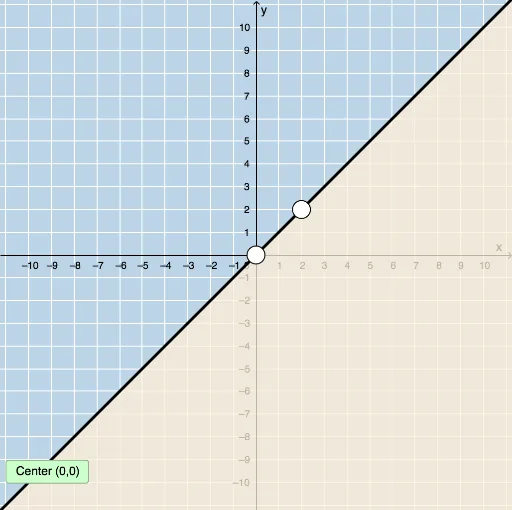
This example demonstrates graphing linear inequalities with two variables and includes a quiz with feedback. Key math concepts involve inequalities, coordinate geometry, and function graphing. It utilizes GeoGebra commands like Random, Sequence, Union, RandomElement, Line, and Slope. Suitable for high school mathematics students and teachers for learning and practice.
GeoGebra Commands & Parameters
Random(-10, 10) → aRandom(-5, 5) → kSequence(i, i, 1, 10, 1) → brightSequence(i, i, -10, -1, 1) → bleftUnion(bleft, bright) → blistRandomElement(blist) → bRandom(1, 4) → nLine(A, B) → jLine(A, B) → lSlope(j) → p
AI Drawing Prompt Reference
Draw a plane graph with two coordinate axes. Draw two lines with different slopes. Randomly select a reference point and generate other points based on the slopes. Ensure the graph is clear and labels key points.
The prompt above was compiled from the original drawing commands and is for reference only.