
Graphing Linear Inequalities Quiz with Feedback
Loading the math board and drawing, please wait…
In collections
Graphing Linear Inequalities Book
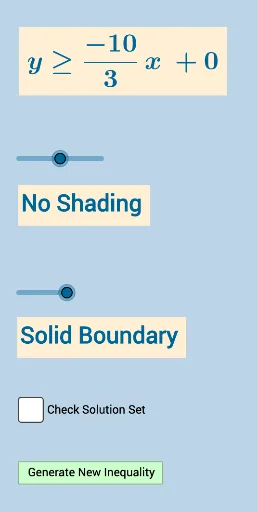
This example demonstrates how to graph linear inequalities in two variables on the coordinate plane. Core mathematical concepts include: solution sets of linear inequalities, graphical features of linear functions, meaning of slope and intercept, and visual representation of inequality regions. Construction details: As shown in the construction summary, the Line command is used to draw boundary lines, Slope command calculates slopes, Random command generates random inequality parameters for quiz purposes, Sequence and Union commands create sequences and sets, and FractionText displays slopes as fractions. Interactive feedback is implemented through buttons and text objects. Suitable for middle school to high school mathematics classes, for practicing inequality graphing methods, understanding the relationship between linear inequalities and lines, or as an in-class assessment tool.
GeoGebra Commands & Parameters
Sequence(i, i, -10, -1) → aSequence(i, i, -10, -1) → bSequence(i, i, 1, 10) → cUnion(b, c) → dRandom(-10, 10) → eLine(A, B) → iFractionText(Slope[f]) → text1FractionText(f(0)) → text2Random(1, 4) → symbolLine(A, B) → hSlope(i) → slope_i
AI Drawing Prompt Reference
Create a coordinate-plane exercise for graphing linear inequalities in two variables. Generate two integer sequences on negative and positive ranges, combine them into a single candidate set, then choose a random parameter from a given interval to define boundary lines. Draw at least one boundary line, and display its slope in fractional form plus the function value at x=0 (the intercept). Also generate a second boundary line using another random parameter and include a corresponding slope display. Arrange the figure so the boundary lines clearly suggest the inequality solution region.
The prompt above was compiled from the original drawing commands and is for reference only.