
Standard Deviation & Variance
Loading the math board and drawing, please wait…
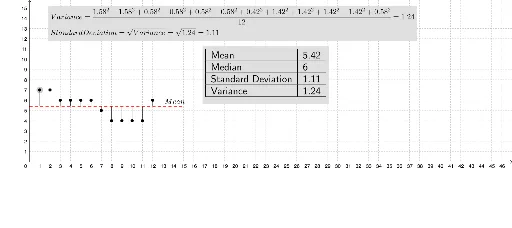
This example dynamically demonstrates the relationship between standard deviation, variance, and the shape of an ellipse, revealing the dispersion of data. Key math concepts include standard deviation, variance, ellipse, matrices, symmetry, general quadrilateral, and bar chart. GeoGebra commands and objects used in construction are mean (average), OrthogonalLine (perpendicular line), Intersect (intersection), Segment (segment), stdevp (population standard deviation), Median (median), Point (point), Name (naming), and TableText (table text). Suitable for high school and above learners to understand the intersection of statistics and analytical geometry.
GeoGebra Commands & Parameters
mean(B1:B12) → B13OrthogonalLine(A, f) → gOrthogonalLine(B, f) → hOrthogonalLine(C, f) → iOrthogonalLine(D, f) → jOrthogonalLine(E, f) → kOrthogonalLine(F, f) → lOrthogonalLine(G, f) → mOrthogonalLine(H, f) → nOrthogonalLine(I, f) → pOrthogonalLine(J, f) → qOrthogonalLine(K, f) → rOrthogonalLine(L, f) → sIntersect(f, g) → MIntersect(f, h) → NIntersect(f, i) → OIntersect(f, j) → PIntersect(f, k) → QIntersect(f, l) → RIntersect(f, m) → SIntersect(f, n) → TIntersect(f, p) → UIntersect(f, q) → VIntersect(f, r) → WSegment(A, M) → tSegment(B, N) → aSegment(C, O) → bSegment(D, P) → cSegment(E, Q) → dSegment(F, R) → eSegment(S, G) → f_1Segment(T, H) → g_1Segment(I, U) → h_1Segment(V, J) → i_1Segment(W, K) → j_1Intersect(f, s) → ZSegment(L, Z) → k_1stdevp(list2) → B15Median(B1:B12) → B14Intersect(f, yAxis) → A_1Point(f) → B_1Segment(A_1, B_1) → l_1Name(Standard) → C1TableText({{A13, B13}, {A14, B14}, {A15, B15}, {A16, B16}}, "|_") → text6