
Standard Deviation Comparison
Loading the math board and drawing, please wait…
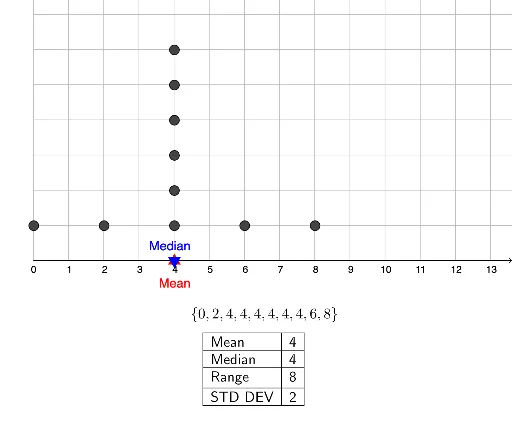
This example demonstrates the comparison of standard deviations of two data sets. It involves the core mathematical concept of standard deviation, a measure of data dispersion. Using GeoGebra commands such as mean, Median, stdevp, Sort, and TableText, the mean, median, standard deviation, and sorted data are constructed and displayed. Suitable for high school mathematics education, particularly in statistics and probability.
GeoGebra Commands & Parameters
mean(A1:A10) → B12Median(A1:A10) → B13stdevp(A1:A10) → Max(A1:A10) - Min(A1:A10)stdevp(A1:A10) → B15Sort(L_2) → L_3mean(E1:E10) → F12Median(E1:E10) → F13stdevp(E1:E10) → F15TableText({{A12, B12}, {A13, B13}, {A14, B14}, {A15, B15}}, "|_ll") → text2TableText({{E12, F12}, {E13, F13}, {E14, F14}, {E15, F15}}, "|_ll") → text3Sort(L_5) → L_6