
Standard Deviation Calculator
Loading the math board and drawing, please wait…
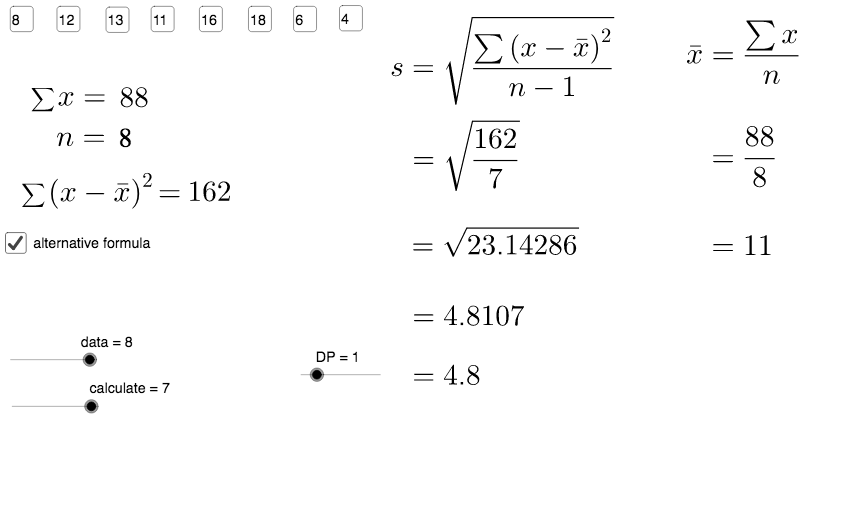
This example demonstrates how to calculate standard deviation using two different formulas. Users can vary the size of the data set and observe the changes in standard deviation in real-time. Core mathematical concepts involved include standard deviation, mean, data sorting, and summation. The construction utilizes GeoGebra commands such as Take, Sort, Sum, CountIf, Textfield, mean, Sequence, TableText, along with objects like data, h, g, a, b, c, d, e, f, list, data_1, sort, sum, n, sortSQ, sumSQ, n_1, SDsq, SD, DP, text5, text2, text3, text4, calculate, DPofSD, text13, text8, inputBox1, inputBox2, inputBox3, inputBox4, inputBox5, inputBox6, text9, text10, mean, text15, text12, text7. It is suitable for high school and above students to learn and understand core concepts in probability and statistics.
GeoGebra Commands & Parameters
Take(list, 1, data) → data_1Sort(data_1) → sortSum(sort) → sumCountIf(x ≤ 1000, sort) → nSum(sortSQ) → sumSQTextfield(a) → inputBox1Textfield(b) → inputBox2Textfield(c) → inputBox3Textfield(d) → inputBox4Textfield(e) → inputBox5Textfield(f) → inputBox6mean(sort) → meanTextfield(g) → inputBox7Textfield(h) → inputBox8Sequence(Element[sort, i] - mean, i, 1, Length[sort]) → devSum(dev^(2)) → sumdevSQTableText({sort, dev, devSQ}, "vc|_") → text22TableText({{sum, " 0 ", sumdevSQ}}, "hc|_") → text23TableText({sort, sortSQ}, "vc|_") → text30Sum(sortSQ) → sumsortSQTableText({{sum, sumsortSQ}}, "hc|_") → text31
AI Drawing Prompt Reference
Create an interactive statistical graph showing two standard deviation calculation methods. Include a data input box where users can input dataset size, dynamically displaying sorted data, mean, squared sums, and other calculation results. The graph should update in real-time to show how data changes affect standard deviation, with key calculation steps and values clearly labeled.
The prompt above was compiled from the original drawing commands and is for reference only.