
Standard Deviation and Distribution Visualization by David Wees
Loading the math board and drawing, please wait…
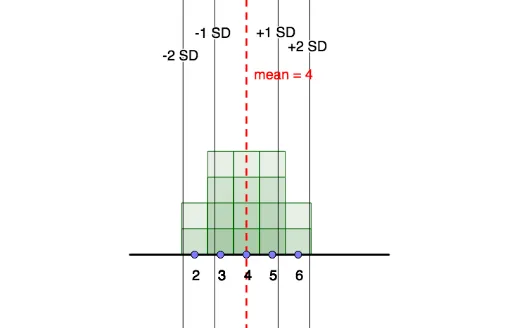
① This interactive GeoGebra activity lets students manipulate a data set and immediately observe how changes in the distribution affect the standard deviation. ② It focuses on the statistical concept of standard deviation as a measure of spread, along with mean, frequency, and mode. ③ The construction uses commands such as Segment, Point, Line, Frequency, Mode, Sequence, and SD to build the coordinate system, data points, and dynamic calculations, with multiple text objects (text1–text16) updating live values. ④ Designed for middle school to introductory college statistics, it serves as a hands-on tool for teaching the sensitivity of standard deviation to data variability and distribution shape.
GeoGebra Commands & Parameters
Segment((0, 0), (9, 0)) → gPoint(g) → MPoint(g) → QPoint(g) → NPoint(g) → LPoint(g) → KPoint(g) → PPoint(g) → CPoint(g) → DPoint(g) → EPoint(g) → FPoint(g) → GPoint(g) → HPoint(g) → IPoint(g) → JPoint(g) → RPoint(g) → OLine(A, B) → fFrequency(list4, list1) → list5Segment((-0.5, 0), (9.5, 0)) → iMode(list1) → list3Mode(list1) → list6Sequence(Sequence[Polygon[(n - 0.5, 0), (n - 0.5, k), (n + 0.5, k), (n + 0.5, 0)], k, 1, Element[list5, n + 1], 1], n, 0, 9, 1) → list2SD(list1) → bPoint(h) → S