
Solving Trig Equations - Cosine Visual Demo
Loading the math board and drawing, please wait…
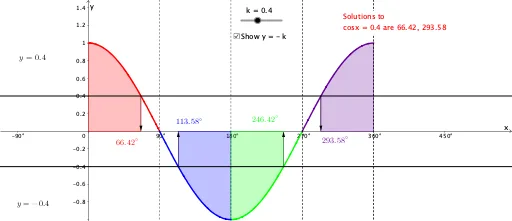
① This GeoGebra example demonstrates how to solve cosine-type trigonometric equations (e.g., cos x = k) graphically, showing the solutions as intersections on the unit circle or the cosine curve. ② Core math concepts include periodicity of trigonometric functions, properties of the cosine graph, number and range of solutions, and the graphical method for solving equations. ③ Construction highlights: from the summary, commands such as Mirror, Rotate, Intersect, and Vector are used, with multiple objects (k, q, f, g, a, b, c, d, etc.) to create dynamic parameters and visualize how changing the constant affects the intersection points and solution set. ④ Suitable for high school or pre-calculus students learning trigonometric equations, and for teachers to illustrate the connection between algebraic and geometric solution approaches.
GeoGebra Commands & Parameters
Mirror(g, a) → g_1Rotate(g_1, 180°, A) → eMirror(g, b) → e'Intersect(g, h_1, (66.42182152179817, 0.4000000000000001)) → BIntersect(h, e) → DIntersect(h, e') → EVector(J, F) → uVector(K, G) → vVector(L, H) → wVector(M, I) → zMirror(a, b) → newMirror(g_1, y = 0) → g_75Integral(f, 180 - (acos(k) * 180 / π), 180) → jIntegral(cos(x°), 180, 180 + (acos(k) * 180 / π)) → mIntegral(cos(x°), 360 - (acos(k) * 180 / π), 360) → nIntegral(g, 0, (acos(k) * 180 / π)) → i
AI Drawing Prompt Reference
Draw a unit circle and a cosine curve to illustrate solving cos x = k graphically. On the unit circle, place a horizontal line representing the constant k, intersecting the circle at two points whose angles are the solutions. On the cosine curve, draw a horizontal line y = k crossing the curve, with intersection x-coordinates as solutions. Use rotations and reflections to create symmetric auxiliary points on the circle, and connect related points with arrow vectors to show correspondence. Shade areas between the curve and the x-axis to emphasize solution intervals. The figure should clearly show periodicity, symmetry, and how changing k affects the solutions.
The prompt above was compiled from the original drawing commands and is for reference only.