
Sine and Quadratic Equations Exploration: Translation and Line Construction
Loading the math board and drawing, please wait…
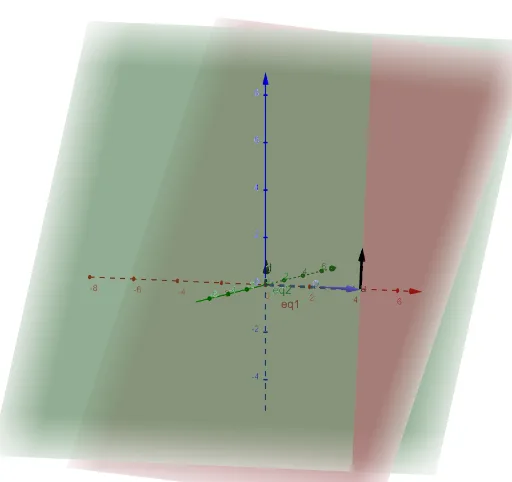
①This GeoGebra example dynamically demonstrates the relationship between a sine function graph and a quadratic equation curve under translation transformations, using lines and rectangles to observe angle changes. ②Core mathematical concepts include sine functions, quadratic equations, translation transformations, angle measurement, and histogram (rectangle) geometric representation, integrating function graphs with geometric objects. ③Construction highlights: From the summary, the Translate command is used for object translation, and the Line command for drawing lines; involved objects include x_{3} (possibly a coordinate or parameter), point P, line d, equations eq1 and eq2, parameter p, vector u, and function f, which together build a dynamic adjustable mathematical scene. ④Suitable for high school or pre-university students to understand the connection between function transformations and geometric intuition, and also useful for teacher demonstrations or student self-exploration.
GeoGebra Commands & Parameters
Translate(Vector[(x_{3} * d)], P) → uLine(P, d) → f