
Derivative and Function Graph
Loading the math board and drawing, please wait…
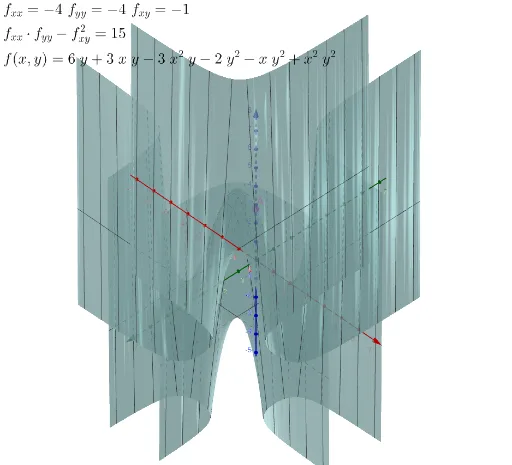
This example demonstrates how to analyze the properties of a function using derivatives, including tangents, extreme points, and inflection points. It involves key mathematical concepts such as derivatives, function graphs, and extrema. Using GeoGebra commands like Derivative and CurveCartesian, dynamic observations of function changes can be made. Suitable for high school mathematics education and learning.
GeoGebra Commands & Parameters
Derivative(f, x) → f_{x}Derivative(f, y) → f_{y}Derivative(f_{x}, x) → f_{xx}Derivative(f_{y}, y) → f_{yy}Derivative(f_{x}, y) → f_{xy}CurveCartesian(t, t, (d * t^(2)), t, -3, 3) → g
AI Drawing Prompt Reference
Draw a function and its derivative to show tangents, extreme points, and inflection points. First, plot the base function curve, then its first derivative to represent tangent slopes, and the second derivative to indicate concavity. Mark the intersection points and trends of these curves to highlight the function's extrema and inflection points, demonstrating dynamic relationships between the function and its derivatives for high school mathematics education.
The prompt above was compiled from the original drawing commands and is for reference only.