
Solving Quadratic Equations Graphically by Adding a Straight Line to a Quadratic
Loading the math board and drawing, please wait…
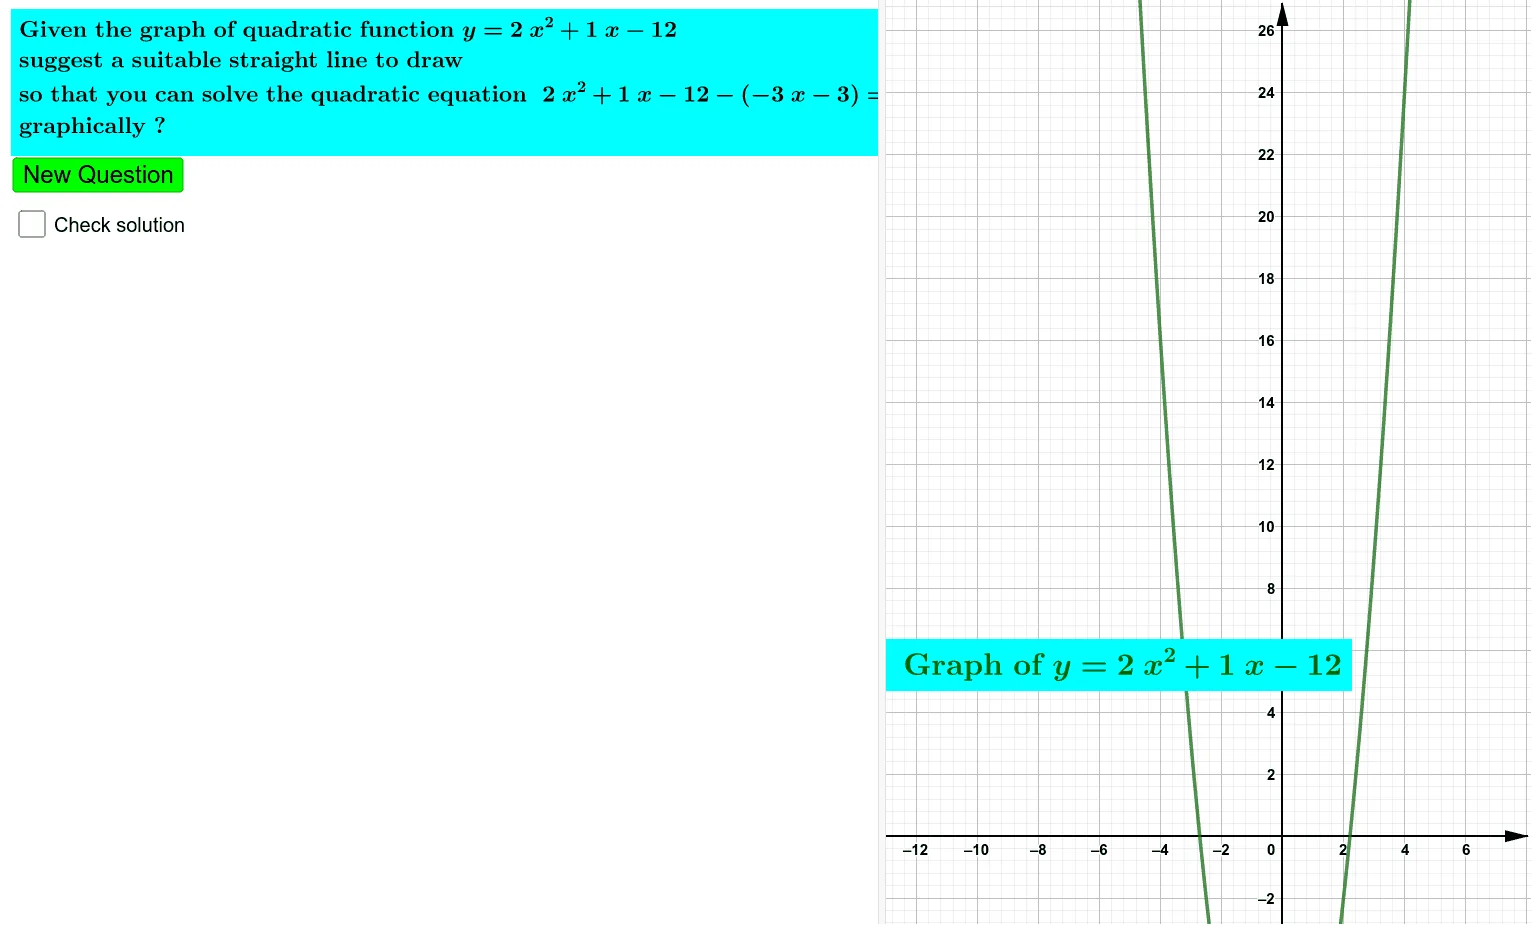
① This GeoGebra example demonstrates how to solve a quadratic equation graphically by adding a straight line to a quadratic function graph and finding their intersection points. ② The core mathematical concepts include quadratic equations, quadratic functions, linear equations, and the relationship between intersection points and equation roots: the x-coordinates of intersections of y=f(x) and y=g(x) are the solutions to f(x)=g(x). ③ Construction highlights: the applet uses commands such as Random, RandomElement, Remove, If, Simplify, Intersect, Extremum, Expand, and Factor to generate random coefficients and compute intersections and vertices. It includes interactive elements like buttons and sliders, with objects for the quadratic function, the line, intersection points, extrema, and adjustable coordinate ranges. ④ This resource is suitable for high school students (or advanced middle school) to explain or review the graphical method of solving quadratic equations, and can be used for classroom demonstration or self-paced exploration.
GeoGebra Commands & Parameters
Random(-8, 9) → B1Random(-4, 5) → D1RandomElement({1, 1, 2, 1}) → A1Random(-13, 15) → C1Remove({emin, emin + 1, emin + 2, emin + 3, emin + 4, emin + 5}, {0}) → listE1aIf(emin > Element[listE1, 1], RandomElement[listE1a], RandomElement[listE1]) → k1Simplify((D1 * x) + E1) → G1Simplify((A1 * x^(2)) + (B1 * x) + C1) → F1Simplify(F1(x) - G1(x)) → H1Random(-8, 9) → B2Random(-13, 15) → C2RandomElement({1, 1, 2, 1}) → A2Random(-4, 5) → D2Simplify((D2 * x) + E2) → G2Simplify((A2 * x^(2)) + (B2 * x) + C2) → F2Simplify(F2(x) - G2(x)) → H2Intersect(G1, F1) → A, BExtremum(F1) → CExpand(H1(x) + G1(x)) → J1Factor(Simplify[H1(x) + G1(x)]) → I1If(TextToUnicode[Text[J1]] ≟ TextToUnicode[Text[I1]], true, false) → K1
AI Drawing Prompt Reference
Draw a coordinate plane with a parabola (quadratic function) and a straight line (linear function) intersecting at two points, marked with solid dots. The parabola has a vertex, also marked with a dot. The equations of the parabola and line are generated with random coefficients, but ensure they intersect. Additionally, display a text box showing the quadratic expression obtained by subtracting the line equation from the parabola equation, along with its factored form, and a boolean value indicating whether the expanded and factored forms are equal. Include adjustable axis ranges, buttons, and sliders for interactivity.
The prompt above was compiled from the original drawing commands and is for reference only.