
Solving Absolute Value Inequalities (Greater Than or Equal To) - Guided Explorat
Loading the math board and drawing, please wait…
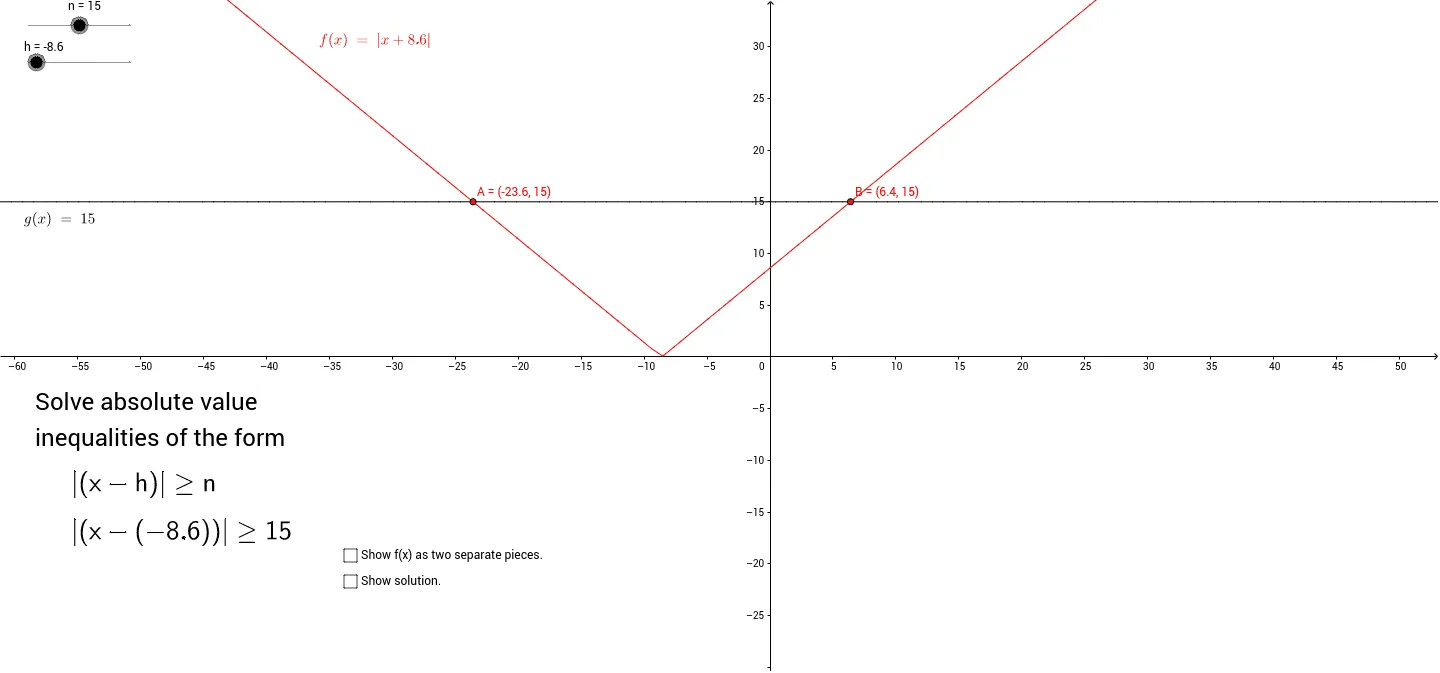
① This GeoGebra example dynamically demonstrates how to solve absolute value inequalities of the form |x-a| ≥ b, visually showing the solution set as two half-infinite intervals on the number line. ② The core mathematical concept is the geometric interpretation of absolute value as distance on the number line, where 'greater than or equal to' corresponds to the union of two rays (or the entire line), involving inequality properties, interval notation, and endpoint inclusion. ③ Construction highlights: from the summary, the example uses the Function command to create piecewise functions (f1, f2), LaTeX for mathematical text (text1_1, text4, etc.), Intersect to find intersection points (i1, i2), and points A, B, C, D with sliders a and b to dynamically adjust parameters, while text objects (text1, text2, etc.) display the solution expressions. ④ Suitable for upper middle school or high school students (grades 9-10) as a guided exploration or self-study activity, helping learners connect graphical intuition with algebraic solving and master number-line representation and interval notation.
GeoGebra Commands & Parameters
Function(-(x - h), -1000, h) → f1Function(x - h, h, 1000) → f2LaTeX(f1, true, true) → text1LaTeX(f2, true, true) → text2Intersect(g, f, (-23.6, 15)) → AIntersect(g, f, (6.3999999999999995, 15)) → BFunction(f1, -1000, S1) → i1Function(f2, S2, 1000) → i2
AI Drawing Prompt Reference
Draw the solution set of the absolute value inequality |x-a|≥b as two half-infinite intervals on a number line. Use dynamic sliders for a and b to adjust parameters, find intersection points for the intervals' endpoints, and draw two rays in different colors, while labeling the mathematical expressions and interval notation.
The prompt above was compiled from the original drawing commands and is for reference only.