
Calculus - Riemann Sums vs. Trapezoids
Loading the math board and drawing, please wait…
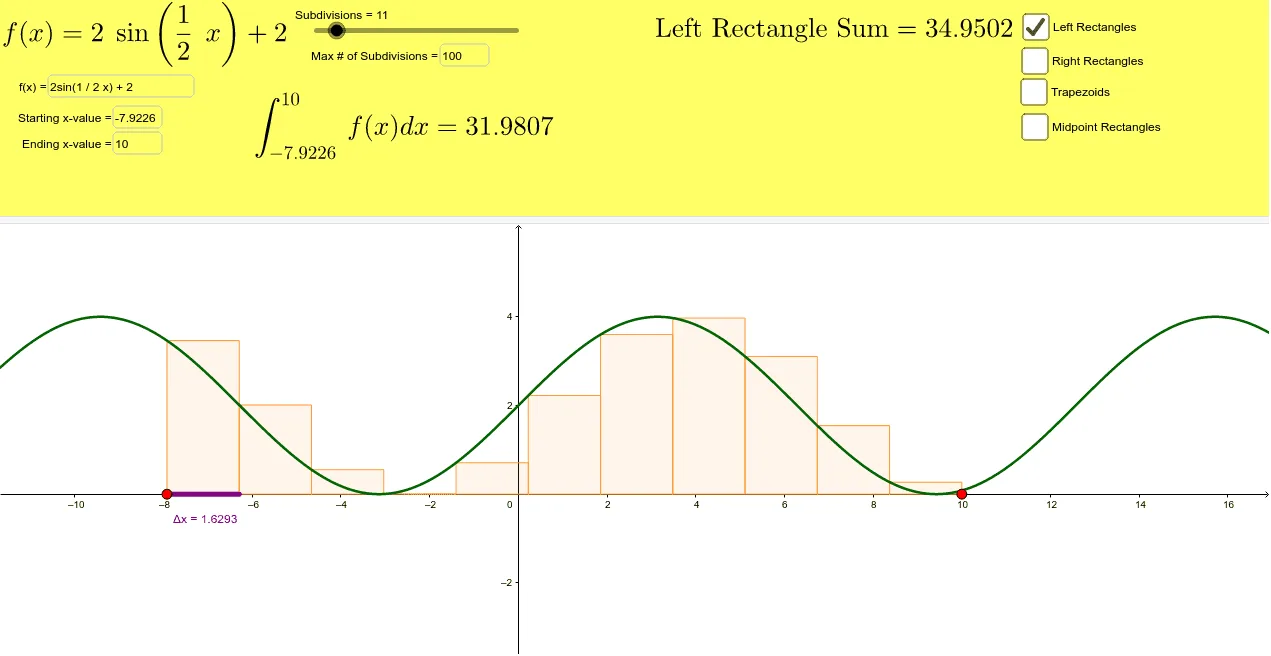
This example demonstrates the application of Riemann sums and trapezoidal sums in approximating integrals. It covers core calculus concepts such as integration, derivatives, and limits. Using GeoGebra commands like RectangleSum and TrapezoidalSum, users can dynamically adjust the number of segments to observe the approximation effects of different methods. Suitable for high school math education and learning integral calculation methods.
GeoGebra Commands & Parameters
RectangleSum(f_1, a, b, Subdivisions, int) → eTextfield(f_1) → InputBox1Textfield(a) → InputBox2Textfield(c) → InputBox4Integral(f_1, a, b) → dSegment(A, C) → ΔxSequence(a + (dx * int) + (dx * i), i, 0, Subdivisions) → list1Sequence((Element[list1, i], 0), i, 1, Subdivisions) → list2Sequence((Element[list1, i], f_1(Element[list1, i])), i, 1, Subdivisions) → list3Sequence(Segment[Element[list2, i], Element[list3, i]], i, 1, Subdivisions) → list4Textfield(b) → InputBox3TrapezoidalSum(f_1, a, b, Subdivisions) → fRectangleSum(f_1, a, b, Subdivisions, 0) → leftRectangleSum(f_1, a, b, Subdivisions, 1) → rightRectangleSum(f_1, a, b, Subdivisions, 0.5) → midpointTrapezoidalSum(f_1, a, b, Subdivisions) → trapezoid
AI Drawing Prompt Reference
Draw a graph showing a function curve over an interval, with multiple approximation methods for its integral. Display left, right, and midpoint Riemann sums as colored rectangles, and trapezoidal sum as trapezoids, all filling the area under the curve. Also show the exact integral as a shaded region. Include small segments marking equal subdivisions along the x-axis. Provide input boxes for adjusting the number of subdivisions and display numerical results for each approximation and the exact value. The layout should clearly compare the different methods visually.
The prompt above was compiled from the original drawing commands and is for reference only.