
Absolute Value Function
Loading the math board and drawing, please wait…
In collections
The GeoGebra's Toolbox for Teachers and Students
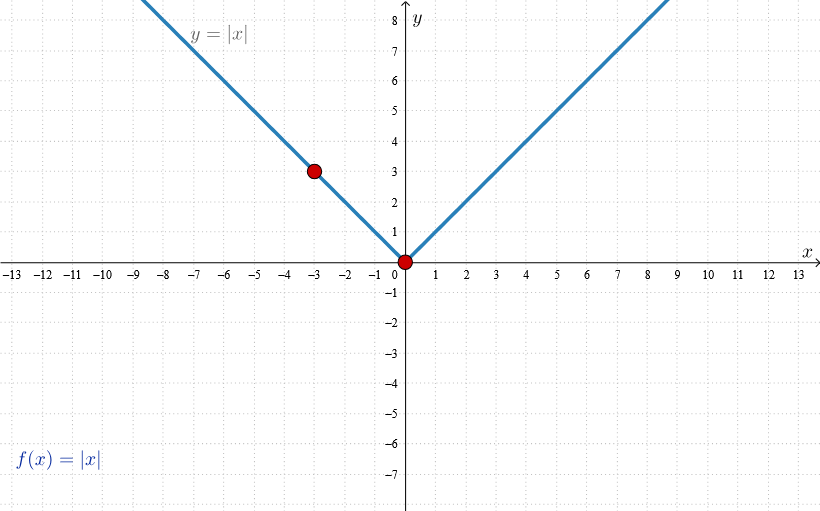
This example demonstrates the graph and properties of absolute value functions. It involves core mathematical concepts such as absolute value functions, function graphs, symmetry of functions, and transformations of functions. The construction points include using GeoGebra's Line and LaTeX commands to draw function graphs, and using objects y0, x0, V1, V2, lin, coeff, f, OR, main, and text1 to construct function equations. Suitable for middle school and high school math teaching, especially for learning functions and graphs.
GeoGebra Commands & Parameters
Line(V2, V1) → linLaTeX(f, true, true) → text1
AI Drawing Prompt Reference
Draw the graph of an absolute value function, including its symmetry and transformations. First, draw a line to represent part of the function. Then, display the function equation using LaTeX and add relevant mathematical text below the graph.
The prompt above was compiled from the original drawing commands and is for reference only.