
Quadratic Inequalities
Loading the math board and drawing, please wait…
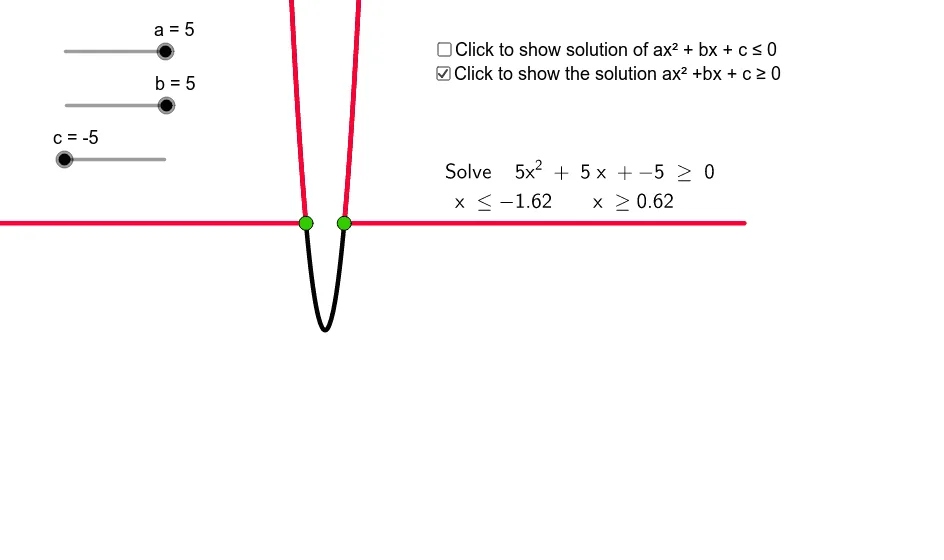
This example demonstrates the graphical representation of quadratic inequalities. It involves key mathematical concepts such as quadratic functions, roots, and intervals. Using GeoGebra commands like Function, Root, and Segment, the example constructs the graph of a quadratic inequality. Suitable for high school mathematics education and learning.
GeoGebra Commands & Parameters
Function(f, e, d) → gFunction(f, d, Infinity) → hRoot(f) → A, BFunction(f, -20, e) → pSegment(A, B) → iSegment(A, C) → jSegment(B, D) → k
AI Drawing Prompt Reference
In a single coordinate plane, draw the graph tied to a quadratic function and mark its x-intercepts (the roots). Then connect the two roots with a segment. Next, create additional segments from each root toward the corresponding endpoints associated with the chosen interval bounds, and include the final segment on the other side to complete the boundary-like construction around the roots and endpoints, following the same step-by-step structure.
The prompt above was compiled from the original drawing commands and is for reference only.