
Illustrating Quadratic Inequalities with Dynamic Visualization
Loading the math board and drawing, please wait…
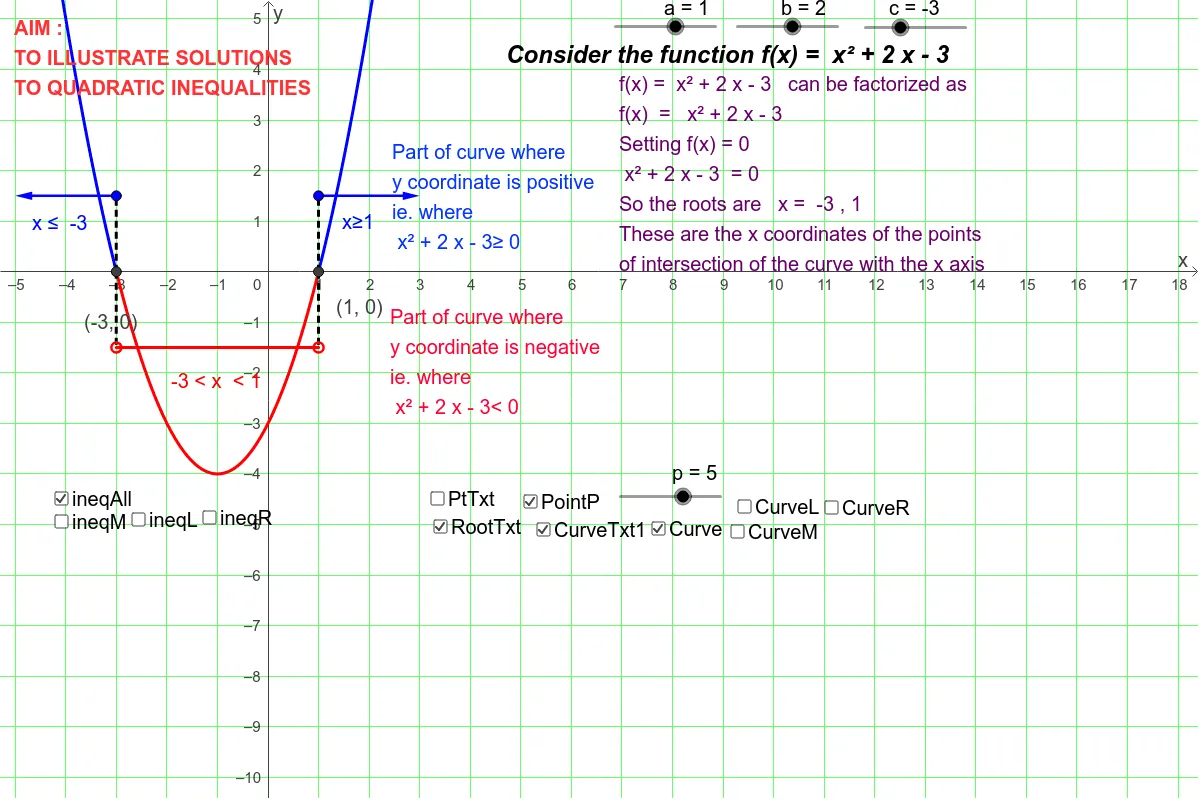
This GeoGebra applet demonstrates how to solve quadratic inequalities by visualizing the parabola and its x-axis intersections (roots). It highlights the regions where the inequality holds using distinct colors, linking algebraic factorization to graphical interval analysis. Core concepts include quadratic functions, inequalities, factoring, roots, and sign charts. Construction details: uses Root to find zeros, Factor to factor the quadratic, Extremum for the vertex, If for conditional coloring, Segment and Vector for auxiliary lines, Midpoint for marking centers, and multiple function objects (f, f_m, f_l) along with sign markers (sign1) to illustrate sign changes across intervals. Suitable for high school classroom demonstrations or self-study, bridging symbolic manipulation with geometric intuition.
GeoGebra Commands & Parameters
Root(a * x^(2.0) + b * x + c) → R_1, R_2Function(a * x^(2.0) + b * x + c, l_l, l_u) → f_mFunction(a * x^(2.0) + b * x + c, -70.0, l_l) → f_lFunction(a * x^(2.0) + b * x + c, l_u, 100.0) → fExtremum(a * x^(2.0) + b * x + c) → TIf(s < 0.0, 0.0, If[s ≟ 0.0, 0.0, 1.0]) → colour1If(s < 0.0, 1.0, 0.0) → colour2If(a > 0.0, 1.0, If[a ≟ 0.0, 0.0, -1.0]) → sign1Segment(R_2, M_R) → dotted1Vector(M_R, M_RR) → v_1Segment(R_1, M_L) → dotted2Segment(M_IL, M_IR) → jMidpoint(j) → M_imSegment(R_1, M_IL) → dotted3Segment(R_2, M_IR) → dotted4If(a < 0.0, Simplify[-(x) + factored2], Simplify[x - factored2]) → factoredexp2If(a^(2.0) ≟ 0.0, sgn(b), 1.0) → v_2signVector(M_L, M_LL) → v_2Factor(f_n) → qIf(sqrt(b^(2.0) - 4.0 * a * c) - floor(sqrt(b^(2.0) - 4.0 * a * c)) > 0.0, "Not Factorizable", "Can") → text2ndIf(b^(2.0) - 4.0 * a * c < 0.0, "No Real Roots!", text2nd) → textDetFactor
AI Drawing Prompt Reference
Draw a parabola representing a quadratic function, with its direction determined by the leading coefficient. Mark its x-intercepts (roots) as points. Use distinct colors to shade regions where the parabola lies above or below the x-axis, illustrating the solution intervals of the quadratic inequality. Between and outside the roots, use solid and dashed lines to indicate sign changes of the function, and mark the vertex. Add auxiliary segments connecting roots to midpoints of intervals, with arrows showing sign transitions. Also display the factored form of the quadratic and a text label indicating whether the discriminant is factorable or has no real roots. Arrange elements clearly for visual analysis of the inequality solution.
The prompt above was compiled from the original drawing commands and is for reference only.