
Writing and Solving Inequalities in One Variable: Interactive Algebra Visualizat
Loading the math board and drawing, please wait…
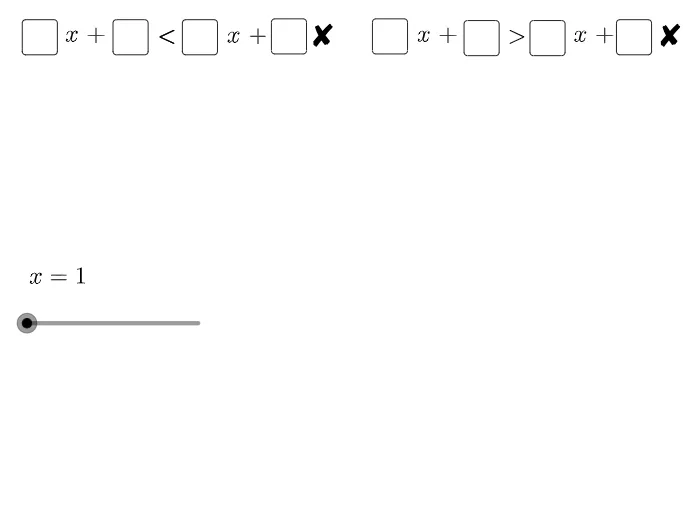
① This GeoGebra example demonstrates how to formulate and solve one-variable linear inequalities, with dynamic visual feedback on a number line or coordinate plane. ② Core mathematical concepts include constructing inequalities from word problems or contexts, applying properties of inequalities (addition/subtraction, multiplication/division by negative numbers), and representing solution sets. ③ Construction highlights: Based on the summary, commands such as Mode, Length, Segment, Textfield, and If are used, along with multiple variables (v1-v8, xValue, constant, n) and objects (points A, B, C, segments l1, l2, text fields). Sliders or input fields allow dynamic parameter changes, and conditional If statements update the displayed solution set in real time. ④ Suitable for middle school (grades 8-9) or high school algebra students, and useful for teachers demonstrating the connection between algebraic manipulation and graphical representation of inequalities.
GeoGebra Commands & Parameters
Mode(l1) → l2Length(l2) → eSegment(I_1, A_1) → ISegment(C, D) → fSegment(D, A) → gSegment(J, B) → hSegment(B, E) → iTextfield(a) → InputBox1_{1}Textfield(b) → InputBox2_{1}Textfield(c) → InputBox3_{1}Textfield(d) → InputBox4_{1}Segment(J_1, K_1) → pSegment(C1, I_1) → qSegment(K_1, E_1) → rSegment(I_1, A_1) → sIf(correct, "✔", "✘") → text4If(correct1, "✔", "✘") → text5If(e ≟ 0, "", "You have repeated digits.") → text3Textfield(v1) → InputBox1Textfield(v2) → InputBox2Textfield(v3) → InputBox3Textfield(v4) → InputBox4Textfield(v5) → InputBox5Textfield(v6) → InputBox6Textfield(v7) → InputBox7Textfield(v8) → InputBox8
AI Drawing Prompt Reference
Draw a number line to represent the solution set of a one-variable linear inequality. Start by drawing points A and B on the number line and connecting them with a segment. Then draw points C and D, and connect them with a segment, followed by connecting D and A. Draw points J and B, and connect J and B, then connect B and E. Use input boxes to enter the coefficients and constant of the inequality, dynamically adjust the segments based on the input, and display the correctness of the solution set.
The prompt above was compiled from the original drawing commands and is for reference only.