
Soccer Team Goals: Mean vs. Median
Loading the math board and drawing, please wait…
In collections
CCSS Support Algebra I Unit 3
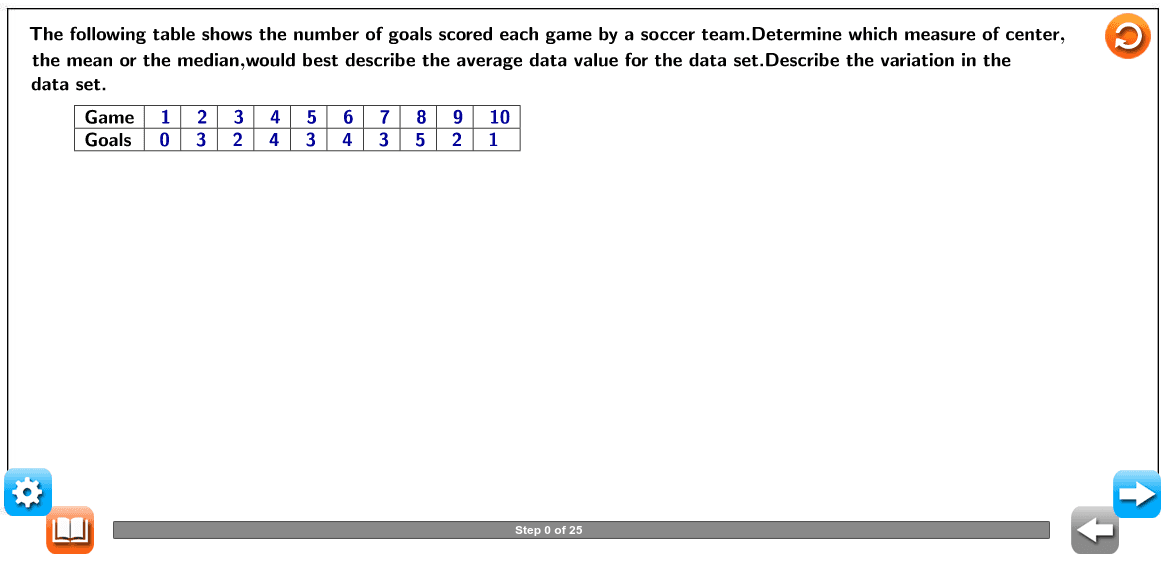
This example demonstrates how to use GeoGebra to create histograms and box plots for a soccer team's goals per game, focusing on the concepts of mean, median, and probability & statistics. It utilizes commands like LaTeX, Polygon, Sort, Element, Segment, Sequence, DotPlot, Sum, Median, Mean, TableText, and BoxPlot as outlined in the construction summary, making it suitable for high school students learning data analysis and statistics.
GeoGebra Commands & Parameters
LaTeX((("\text{" * val3) * "}")) → Equaliservalue2LaTeX((("\text{" * val4) * "}")) → Equaliservalue3LaTeX((("\text{" * val5) * "}")) → Equaliservalue4LaTeX((("\text{" * val7) * "}")) → Equaliservalue6LaTeX((("\text{" * val8) * "}")) → Equaliservalue7LaTeX((("\text{" * val9) * "}")) → Equaliservalue8LaTeX((("\text{" * val2) * "}")) → Equaliservalue1LaTeX((("\text{" * val6) * "}")) → Equaliservalue5Polygon((7.8, y(Corner[1])), Corner[2], Corner[3], (7.8, y(Corner[4]))) → Mask, a, b, e, hLaTeX((("\text{" * val1) * "}")) → Equaliservalue9LaTeX((("\text{" * val10) * "}")) → Equaliservalue10LaTeX("\text{Goals}") → Datakittext1Polygon(PolyA, PolyB, PolyC, PolyD) → Mask2, a_1, b_1, c_1, d_1Sort(list1) → sortElement(sort, 1) → sort1Element(sort, 2) → sort2Element(sort, 3) → sort3Element(sort, 4) → sort4Element(sort, 5) → sort5Element(sort, 6) → sort6Element(sort, 7) → sort7Element(sort, 8) → sort8Element(sort, 9) → sort9Element(sort, 10) → sort10Segment((0, 0), (0, 5)) → iSequence(Segment[A_0 + (i, 0), A_0 + (i, (-0.3))], i, 0, 5) → Scalelist1Sequence(Segment[A_0 + (i, 0), A_0 + (i, 0.3)], i, 0, 5) → Scalelist2Segment(A, B) → jDotPlot(sort) → DotplotLaTeX("\text{The following table shows the number of goals scored each game by a soccer team.Determine which measure of center,}") → QuestionTextLaTeX("\text{the mean or the median,would best describe the average data value for the data set.Describe the variation in the }") → text2LaTeX("\text{data set. }") → text3LaTeX("\text{Order the data from least to greatest. }") → text4LaTeX("\text{Ordering the data helps in understanding whether it contains an outlier and what the shape is. }") → text5LaTeX((((((((((((((((((((("\text{The ordered data for the number of goals is \textcolor{#000099}{" * sort1) * "}, \textcolor{#000099}{") * sort2) * "}, \textcolor{#000099}{") * sort3) * "}, \textcolor{#000099}{") * sort4) * "}, \textcolor{#000099}{") * sort5) * "}, \textcolor{#000099}{") * sort6) * "}, \textcolor{#000099}{") * sort7) * "}, \textcolor{#000099}{") * sort8) * "}, \textcolor{#000099}{") * sort9) * "}, \textcolor{#000099}{") * sort10) * "}. }")) → text6LaTeX("\text{Determine which measure of center best describes the average data value. }") → text8LaTeX("\text{Create a dot plot of the data. }") → text10LaTeX("\text{or the mean would be valid measures of center for this set.}") → text13LaTeX("\text{Calculate the mean. }") → text14LaTeX((((((((((((((((((((("\text{\textcolor{#000099}{\frac{" * sort1) * "+") * sort2) * "+") * sort3) * "+") * sort4) * "+") * sort5) * "+") * sort6) * "+") * sort7) * "+") * sort8) * "+") * sort9) * "+") * sort10) * "}{10}}}")) → text17Sum({sort1, sort2, sort3, sort4, sort5, sort6, sort7, sort8, sort9, sort10}) → sumMedian({sort1, sort2, sort3, sort4, sort5, sort6, sort7, sort8, sort9, sort10}) → medianMean({sort1, sort2, sort3, sort4, sort5, sort6, sort7, sort8, sort9, sort10}) → meanLaTeX((("\text{\textcolor{#000099}{=\frac{" * sum) * "}{10}}}")) → text18LaTeX((("\text{\textcolor{#000099}{=" * mean) * "}}")) → text19LaTeX("\text{Calculate the median. }") → text21LaTeX("\text{This data does not have any values that are much greater or less than the rest of the values in the set,}") → text7LaTeX("\text{so there are no outliers.}") → text7_1LaTeX("\text{determine the median. }") → text24LaTeX("\text{Describe the variation in the data set.}") → text26LaTeX("\text{Draw a line from each dot to the rectangle.The completed box plot follows. }") → text39LaTeX("\text{Dot plots help determine whether data is symmetric,skewed left,or skewed right. }") → text9LaTeX("\text{sum of the number of goals scored divided by the number of games played,\textcolor{#000099}{10}. }") → text16LaTeX((("\text{is \textcolor{#000099}{" * median) * "}.}")) → text25LaTeX("\text{Determine the median,first quartile,and third quartile for the number of goals scored each game. }") → text30LaTeX((("\text{We have already determined that the median is \textcolor{#000099}{" * median) * "}.}")) → text31LaTeX("\text{The third quartile,\textcolor{#000099}{Q₃},is the middle value in the second half of the data.The middle value of the }") → text32LaTeX((((("\text{second half of the data is \textcolor{#000099}{" * sort8) * "}.Therefore,the third quartile is \textcolor{#000099}{") * sort8) * "}. }")) → text35LaTeX((((("\text{Create a rectangle that begins at \textcolor{#000099}{" * sort3) * "} and extends to \textcolor{#000099}{") * sort8) * "} to represent the first and third quartile.Draw}")) → text36LaTeX((("\text{a vertical line at \textcolor{#000099}{" * median) * "} to represent the median. }")) → text37LaTeX((((("\text{Place dots at the smallest and largest values,\textcolor{#000099}{" * sort1) * "} and \textcolor{#000099}{") * sort10) * "}. }")) → text38LaTeX("\text{\mathbf{Dot \;plot} a frequency plot that shows the number of times a response occurred in a}") → text43LaTeX("\text{data set,where each data value is represented by a dot.}") → text44LaTeX("\text{the number of data points.}") → text46LaTeX("\text{\mathbf{Mean} the average value of a data set,found by summing all values and dividing by}") → text45LaTeX("\text{Goals}") → Diagram_text42LaTeX("\text{The data is fairly symmetric.As determined in step 1,none of the values are much greater}") → text11LaTeX("\text{ or much less than the other values,so there is no outlier.Therefore,either the median}") → text12LaTeX("\text{Box plots show the variation of a data set,so create a box plot of the data. }") → text27LaTeX("\text{For the number of goals scored each game,begin by creating a number line that covers the range}") → text28LaTeX("\text{of the set of data.The data ranges from \textcolor{#000099}{0} to \textcolor{#000099}{5},so this is a reasonable range for the number line. }") → text29LaTeX("\text{The first quartile,\textcolor{#000099}{Q₁},is the middle value in the first half of the data.The middle value of the }") → text33LaTeX((((("\text{first half of the data is \textcolor{#000099}{" * sort3) * "}.Therefore,the first quartile is \textcolor{#000099}{") * sort3) * "}. }")) → text34LaTeX("\text{the first and third quartiles,indicating a symmetric distribution. }") → text41TableText({{LaTeX["\text{Game}"], LaTeX["\text{ \textcolor{#000099}{1}}"], LaTeX["\text{ \textcolor{#000099}{2}}"], LaTeX["\text{ \textcolor{#000099}{3}}"], LaTeX["\text{ \textcolor{#000099}{4}}"], LaTeX["\text{ \textcolor{#000099}{5}}"], LaTeX["\text{ \textcolor{#000099}{6}}"], LaTeX["\text{ \textcolor{#000099}{7}}"], LaTeX["\text{ \textcolor{#000099}{8}}"], LaTeX["\text{ \textcolor{#000099}{9}}"], LaTeX["\text{ \textcolor{#000099}{10}}"]}, {LaTeX["\text{Goals}"], LaTeX[(("\text{\textcolor{#000099}{\;" * val1) * "}}")], LaTeX[(("\text{\textcolor{#000099}{\;" * val2) * "}}")], LaTeX[(("\text{\textcolor{#000099}{\;" * val3) * "}}")], LaTeX[(("\text{\textcolor{#000099}{\;" * val4) * "}}")], LaTeX[(("\text{\textcolor{#000099}{\;" * val5) * "}}")], LaTeX[(("\text{\textcolor{#000099}{\;" * val6) * "}}")], LaTeX[(("\text{\textcolor{#000099}{\;" * val7) * "}}")], LaTeX[(("\text{\textcolor{#000099}{\;" * val8) * "}}")], LaTeX[(("\text{\textcolor{#000099}{\;" * val9) * "}}")], LaTeX[(("\text{\textcolor{#000099}{\;" * val10) * "}}")]}}, "l|_") → TabularFormBoxPlot(1.5, 0.5, sort1, sort3, median, sort8, sort10) → BoxplotLaTeX((((("\text{The data varies from \textcolor{#000099}{" * sort1) * "\; goals} to \textcolor{#000099}{") * sort10) * " \;goals} and is evenly distributed.The median is halfway between }")) → text40LaTeX("\text{The mean is the sum of the values divided by the number of values.In this case,the mean is the}") → text15LaTeX("\text{\mathbf{Median} \textcolor{#000099}{1.} The middle-most value of a data set;\textcolor{#000099}{50%} of the data is less than this}") → text47LaTeX("\text{value,and \textcolor{#000099}{50%} is greater than it.}") → text48LaTeX("\text{\textcolor{#000099}{2}.The segment joining the vertex to the midpoint of the opposite side.}") → text49LaTeX("\text{The data set has an even number of values,so take the average of the two middle values to}") → text22LaTeX((((("\text{The two middle values when the data is ordered from least to greatest are \textcolor{#000099}{" * sort5) * "} and \textcolor{#000099}{") * sort6) * "},so the median}")) → text23LaTeX((("\text{The mean is \textcolor{#000099}{" * mean) * "}.}")) → text20