
Slope Field Plotter by Kristen Beck
Loading the math board and drawing, please wait…
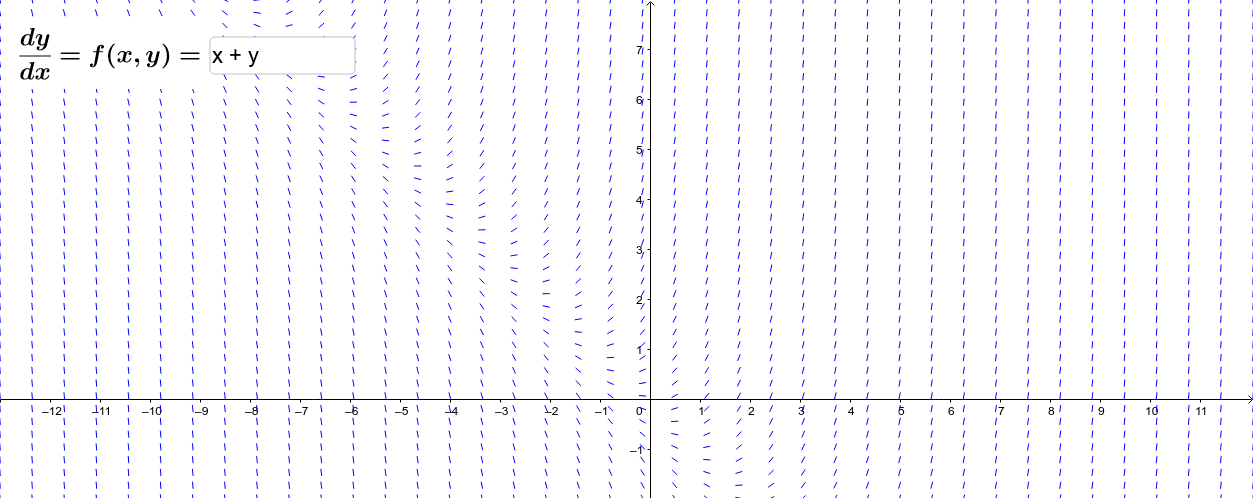
This example demonstrates the plotting of slope fields for differential equations, visually showing the distribution of solution curves. It involves core mathematical concepts such as differential equations, continuity, tangent lines, subtraction, arithmetic, and squares. The construction uses GeoGebra commands like SlopeField for plotting, Textfield and SolveODE for solving and displaying solution curves, with objects including f, S, text1, InputBox1, g, c_1, c_2, c_3. It is suitable for high school and above students to learn and understand the geometric meaning of differential equations, useful for classroom demonstrations and exploratory learning.
GeoGebra Commands & Parameters
SlopeField(f(x, y)) → STextfield(f) → InputBox1SolveODE(f) → g
AI Drawing Prompt Reference
Plot a slope field to show the distribution of solution curves for a differential equation, including an input box for entering the equation, solving and displaying solution curves, demonstrating the geometric meaning of differential equations.
The prompt above was compiled from the original drawing commands and is for reference only.