
Slope, Average Rate, and Instantaneous Rate of Change
Loading the math board and drawing, please wait…
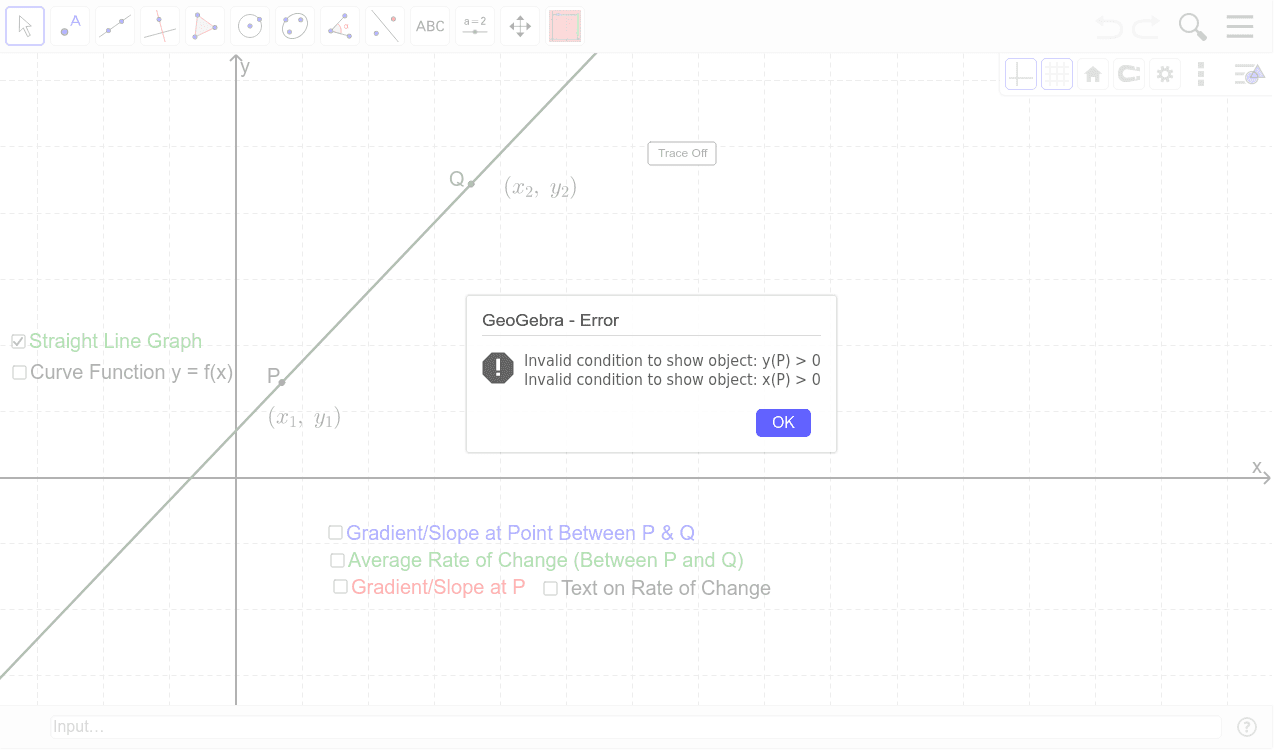
This applet demonstrates the concept of slope for both straight lines and the tangent at a point on a curve. It also shows how to calculate average and instantaneous rates. Using GeoGebra commands like Point, Tangent, Line, etc., you can dynamically explore these concepts. Suitable for high school mathematics education and learning.
GeoGebra Commands & Parameters
Point(c) → PTangent(P, c) → a,Point(c) → QLine(P, Q) → bPoint(c) → ALine(P, A) → dPoint(c) → BLine(P, B) → ePoint(c) → CTangent(C, c) → f,Vector(P, (x(Q), y(P))) → uVector((x(Q), y(P)), Q) → vLine(P, Q) → jPoint(j) → Q'Vector((x(Q'), y(P)), Q') → wVector(P, (x(Q'), y(P))) → zPoint(j) → C'Segment(C', D') → lOrthogonalLine(D', l) → mIntersect(m, j) → EPolygon(C', D', E) → poly1, e_1, c', d_1Intersect(n, f) → FPolygon(C, D, F) → poly2, f_1, c_1, d_2Intersect(p, a) → GPolygon(P, P_x, G) → poly3, g_1, p_1, p_x
AI Drawing Prompt Reference
Draw a straight line and a curve, then select a point on the curve to draw a tangent line, showing the relationship between the tangent and the line. Select two points on the line, connect them, and draw a parallel line to this segment. On the curve, select three more points, draw tangents at these points, and show their relationships with the curve. Finally, connect the intersection points of the tangents with the curve to form multiple polygons, visually demonstrating the concepts of slope, average rate of change, and instantaneous rate of change.
The prompt above was compiled from the original drawing commands and is for reference only.