
Sine Graph
Loading the math board and drawing, please wait…
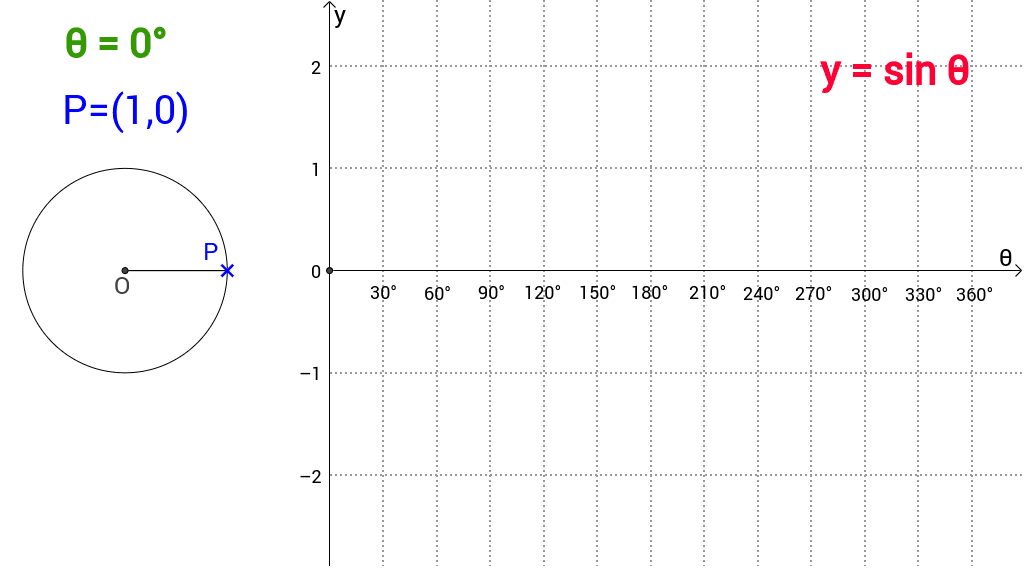
This example demonstrates the construction of the sine graph starting from a unit circle. Key mathematical concepts include the sine function, unit circle, and vectors. Using GeoGebra commands such as Point, Segment, Angle, etc., the construction process of the sine graph is dynamically shown. Suitable for high school mathematics education and learning the properties of the sine function.
GeoGebra Commands & Parameters
Point(c) → PSegment(P, O) → aSegment(B, O) → bAngle(B, O, P) → αText("30°") → text1Text("60°") → text2Text("90°") → text3Text("120°") → text4Text("150°") → text5Text("180°") → text6Text("360°") → text7Text("210°") → text8Text("240°") → text9Text("270°") → text10Text("300°") → text11Text("330°") → text12Text("θ = " * α) → text13Text("P=(" * e * "," * d * ")") → text14Text("y = sin θ") → text15