
Odd Function Demonstration
Loading the math board and drawing, please wait…
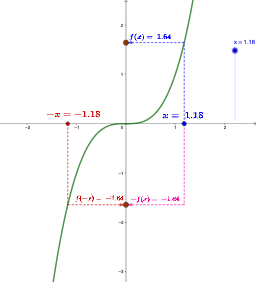
This example demonstrates the symmetry of an odd function by plotting the function f(x) and related graphics to showcase its point symmetry about the origin. Key mathematical concepts include the definition of odd functions, symmetry, vectors, midpoints, and analytical geometry construction. GeoGebra commands and objects used in the construction are Segment, Vector, and Midpoint. Suitable for high school mathematics teaching to help students visually understand the geometric meaning and properties of odd functions.
GeoGebra Commands & Parameters
Segment(C, A) → gSegment(E, D) → iVector(A, B) → vMidpoint(F, A) → GMidpoint(D, F) → HMidpoint(F, H) → IMidpoint(G, F) → JVector(D, K) → uMidpoint(D, K) → LSegment(C, M) → hVector(M, K) → wMidpoint(K, M) → N
AI Drawing Prompt Reference
Draw an odd function and demonstrate its point symmetry about the origin. First, plot the function graph, then draw line segment g through points A and C, and line segment i through points D and E. Next, draw vector v from A to B, find the midpoint G of A, the midpoint H of F, and the midpoint I of F and H. Then, draw vector u from D to K, the midpoint L of D and K, and line segment h from C to M. Finally, draw vector w from M to K, and the midpoint N of K and M.
The prompt above was compiled from the original drawing commands and is for reference only.