
Sound Wave Autograph
Loading the math board and drawing, please wait…
In collections
Música y Matemáticas
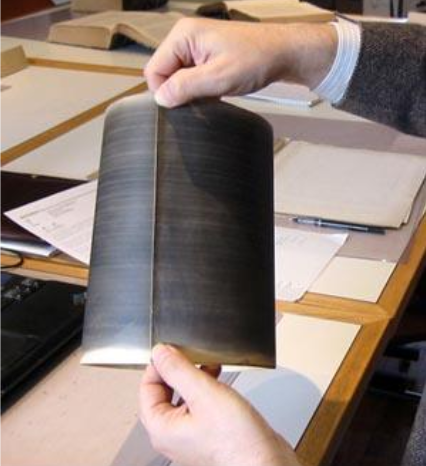
This example demonstrates how to use GeoGebra to construct a sound wave autograph, transforming sound signals into mathematical graphs. Core math concepts include vectors, functions, matrix operations, and trigonometric functions. Construction highlights involve using GeoGebra commands/objects A, B, imagen2 for sound signal modeling, vector operations, and function graph plotting. Suitable for high school students and math enthusiasts learning vectors, function graphs, and matrix applications.
GeoGebra Commands & Parameters
Point A(-16.785, 5.225)Point B(-9.415, 5.225)
AI Drawing Prompt Reference
Draw a simple graph consisting of two points, A and B. Point A is at (-16.785, 5.225) and point B is at (-9.415, 5.225). Connect these points with a line to form a straight line. The graph should remain simple, containing only these points and the connecting line.
The prompt above was compiled from the original drawing commands and is for reference only.