
Sine Function Tracer
Loading the math board and drawing, please wait…
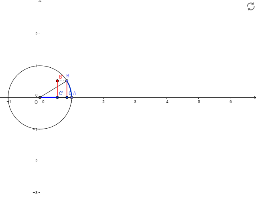
This applet dynamically traces the sine function by linking a point rotating on the unit circle to its y-coordinate plotted on a Cartesian plane. It demonstrates the fundamental relationship between circular motion and trigonometric graphs, covering concepts such as the unit circle, sine function, periodicity, amplitude, and transformations like rotation and reflection. The construction uses GeoGebra commands including Intersect, Point, Circle, Segment, and CircleArc to build the unit circle, radius segments, arcs, and intersection points. A slider or animation drives point B along the circle, while the vertical coordinate of point C is traced to generate the sine curve. This interactive tool is ideal for high school students learning trigonometric functions, as well as for pre-calculus courses or teacher demonstrations to visualize how the sine wave emerges from circular rotation.
GeoGebra Commands & Parameters
Intersect(xAxis, yAxis) → OPoint(xAxis) → ACircle(O, A) → cPoint(c) → BSegment(A, O) → aSegment(O, B) → bCircleArc(O, A, B) → dSegment(O, C') → eSegment(B', C') → fSegment(B, C) → gSegment(B, B') → h