
Sine Function Modeling (y = a sin(x) + d) Quiz
Loading the math board and drawing, please wait…
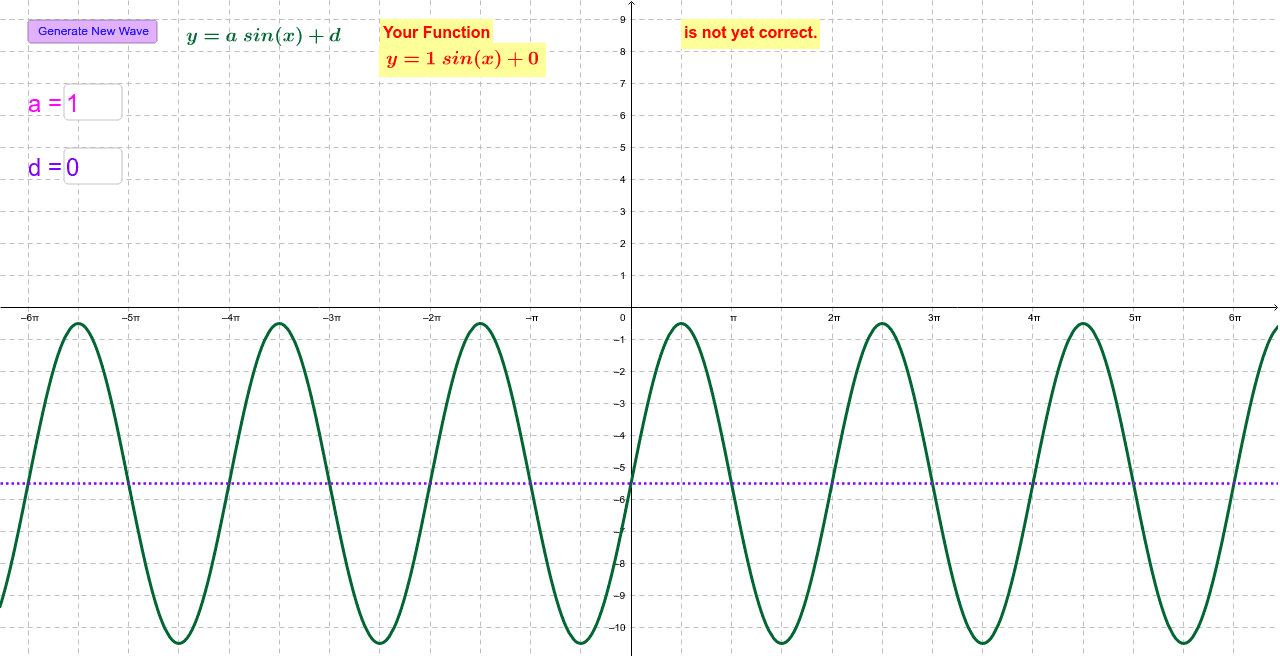
This example demonstrates how to plot the sine function y = a sin(x) + d by adjusting parameters a and d. Core math concepts include sine function, function graph transformations (scaling and shifting), and the application of parametric equations. It utilizes GeoGebra commands like Sequence, RandomElement, Textfield, and objects such as Lista, Listd, w, button1, text1, a, d, InputBox1, InputBox2, g, f, text2, b, text5, text5_1, text4, text3. Suitable for high school students learning sine function transformations, ideal for classroom demonstrations or homework practice.
GeoGebra Commands & Parameters
Sequence(i, i, -8, 8, 0.5) → ListaSequence(i, i, -8, 8, 0.5) → ListdRandomElement(Listd) → wTextfield(a) → InputBox1Textfield(d) → InputBox2
AI Drawing Prompt Reference
Draw a sine function graph. The graph should show a curve representing y = a sin(x) + d. Markers for parameters a and d should be included. The construction order is to draw the x-axis and y-axis first, generate an x-value sequence, compute corresponding y-values, then draw the curve and add markers.
The prompt above was compiled from the original drawing commands and is for reference only.