
Sine Function by Steve Phelps
Loading the math board and drawing, please wait…
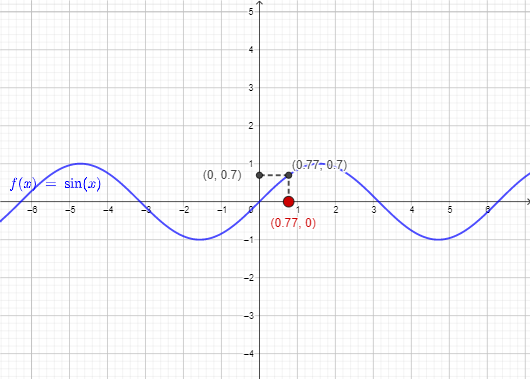
This example demonstrates the graph of the sine function. It involves core concepts of trigonometry. Using GeoGebra commands such as Point and Segment, the sine function graph is constructed. Suitable for high school mathematics education and learning.
GeoGebra Commands & Parameters
Point(xAxis) → ASegment(A, B) → gSegment(B, C) → h
AI Drawing Prompt Reference
Draw the graph of a sine function, showcasing its core trigonometric concept. Start by plotting a point on the x-axis, then draw a line segment from this point, and continue with another line segment from the end of the first one to form a simple geometric construction that illustrates the sine function's graph.
The prompt above was compiled from the original drawing commands and is for reference only.