
Sine Curve Transformation
Loading the math board and drawing, please wait…
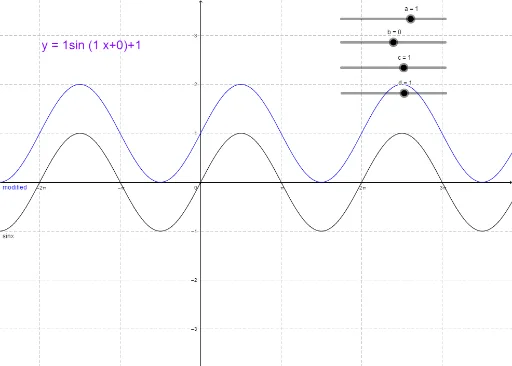
This example demonstrates how to modify a sine curve by adjusting parameters a, b, c, d. It involves core math concepts like sine functions, trigonometric functions, parameter transformations, and coordinate geometry. Constructed using GeoGebra commands/objects: sinx, a, b, c, d, modified, Formula. Suitable for high school mathematics teaching to understand the impact of parameters on function graphs.
GeoGebra Commands & Parameters
sinx(x) = sin(x)Numeric a(1)Numeric b(0.004)Numeric c(1)Numeric d(1)modified(x) = (a * sin((c * x) + b)) + d
AI Drawing Prompt Reference
Draw a sine curve and demonstrate how adjusting four parameters a, b, c, d modifies it. Start by plotting the basic sine function sin(x), then set initial values for the parameters as 1, 0.004, 1, 1. Next, plot the modified curve using the formula y=a*sin(c*x+b)+d to show the impact of parameter changes on the sine wave, illustrating key concepts in trigonometry and coordinate geometry.
The prompt above was compiled from the original drawing commands and is for reference only.