
Sine & Cosine Function Modeling: Finding Correct Parameters
Loading the math board and drawing, please wait…
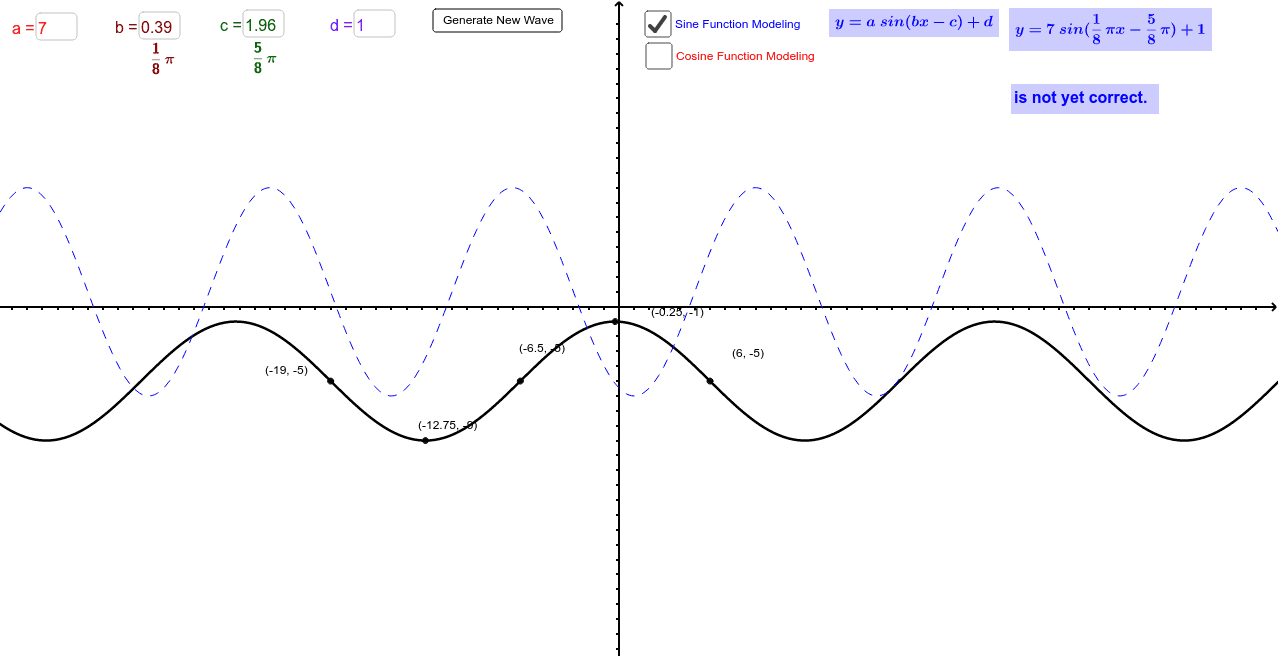
This example demonstrates how to model random sinusoidal waves using the function y = a sin(bx - c) + d. It involves core math concepts like trigonometric functions, function graph fitting, and parameter adjustment. Constructed with GeoGebra commands like Sequence, RandomElement, FitSin, and objects such as button1, List1, sliders A, B, C, D. Suitable for high school mathematics teaching to understand trigonometric function models and their parameter significance.
GeoGebra Commands & Parameters
Sequence(i, i, 4, 30, 1) → List1RandomElement(List1) → wSequence(i, i, -8, 8, 0.25) → List2RandomElement(List2) → aFitSin(list1) → gTextfield(a_1) → InputBox1Textfield(d_1) → InputBox2Textfield(b_1) → InputBox3Textfield(c_1) → InputBox4
AI Drawing Prompt Reference
Draw a random sine wave using the function y = a sin(bx - c) + d. First, generate two random number lists to control the wave's period and phase. Then, use the FitSin command to fit a sine wave. Finally, adjust parameters a, d, b, and c to observe the changes in the wave.
The prompt above was compiled from the original drawing commands and is for reference only.