
Simulation (2014 #2)
Loading the math board and drawing, please wait…
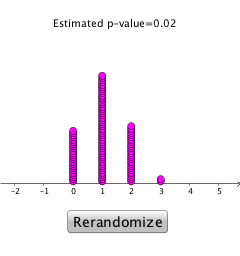
This example demonstrates how to use random simulation to calculate variance. Key mathematical concepts include variance calculation in probability and statistics. Using GeoGebra commands such as Join, Shuffle, Take, CountIf, and DotPlot, random data lists are generated and a dot plot is created. Suitable for high school mathematics education and students learning probability and statistics.
GeoGebra Commands & Parameters
Join({Sequence["M", a, 1, 6], Sequence["W", a, 1, 3]}) → list1Shuffle(list1) → list2Take(list2, 1, 3) → list3CountIf(x ≟ "W", list3) → aDotPlot(data, false, 0.1) → list4