
Histogram Example
Loading the math board and drawing, please wait…
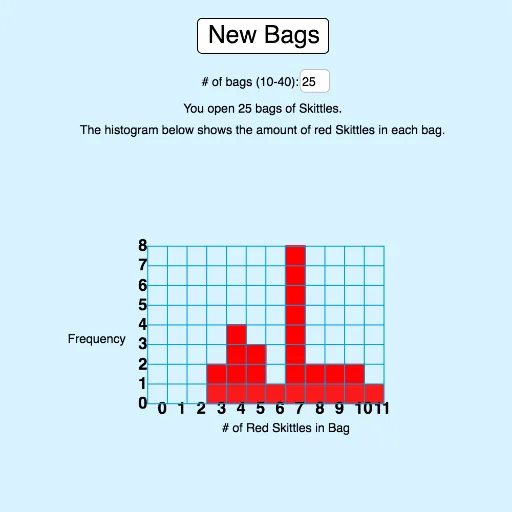
This example demonstrates how to create a histogram using GeoGebra to visualize data distribution. Key math concepts include symmetry, incircle or inscribed circle, median line, and mode. Construction involves commands like Textfield, Sequence, Unique, Frequency, and objects such as n, inputBox1, s, S, B, Bunique, Bfreq, k, button1, Bars, Numbers, a, Vlines, Hlines, list3, Dots, xmin, xmax, ymin, ymax, text1, text2, text3, text4. Suitable for high school probability and statistics education.
GeoGebra Commands & Parameters
Textfield(n) → inputBox1Sequence(RandomBinomial[S, 0.2], i, 1, n) → BUnique(B) → BuniqueFrequency(B) → BfreqSequence(Sequence[Polygon[(Element[Bunique, i] - 0.5, j - 1), (Element[Bunique, i] + 0.5, j - 1), (Element[Bunique, i] + 0.5, Element[Bfreq, i]), (Element[Bunique, i] - 0.5, Element[Bfreq, i])], j, 1, Element[Bfreq, i]], i, 1, Length[Bunique]) → BarsSequence(Text[i, (i, -0.5)], i, 0, Max[Bunique]) → NumbersSequence(Segment[(i - 0.5, 0), (i - 0.5, Max[Bfreq])], i, 0, Max[Bunique] + 1) → VlinesSequence(Segment[(-0.5, i), (Max[Bunique] + 0.5, i)], i, 0, Max[Bfreq]) → HlinesSequence(Text[i, (-1, i - 0.25)], i, 0, Max[Bfreq]) → list3Sequence(Sequence[Circle[(Element[Bunique, i], j - 0.5), 0.5], j, 1, Element[Bfreq, i]], i, 1, Length[Bunique]) → Dots
AI Drawing Prompt Reference
Draw a histogram visualizing the frequency distribution of random binomial data. The x-axis represents data values, and the y-axis represents frequencies. For each data value, draw a rectangle bar of width 1 and height equal to its frequency. Inside each bar, place a vertical stack of dots (radius 0.5) matching the frequency. Add grid lines: vertical dashed lines from each bar boundary up to the maximum frequency, and horizontal dashed lines from 0 to the maximum frequency. Label integer data values below the x-axis and frequency numbers on the left. The overall graph is symmetric, with median line and mode indicated.
The prompt above was compiled from the original drawing commands and is for reference only.