
Simulating Bubble Generation with Poisson Process
Loading the math board and drawing, please wait…
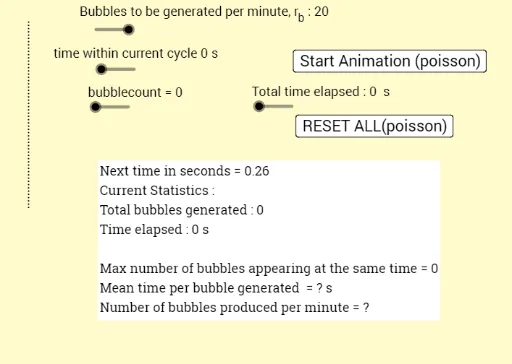
This example demonstrates how to simulate bubble generation timings based on the Poisson process. Key math concepts include Poisson processes, probability & statistics, and random event generation. GeoGebra commands/objects used are Segment, Point, n_{10} to n_1, sumnceil, sumnfloor, P, Q, f, U_1, r, textExplanatory1, anim, U_2, r_b, textExplanatory2, button1, a, button2, nextpage, button3, textDebugBox, text1, textPrimer2, textPrimer3, textPrimer1, ra, b, n_p, nextimsec, bubblecount, timelapsed, poissonanim, button4. Suitable for high school students and above learning probability statistics and random processes, or for educational demonstrations.
GeoGebra Commands & Parameters
Segment(P, Q) → fPoint(f) → U_1Point(f) → U_2Point(f) → U_3Point(f) → U_4Point(f) → U_5Point(f) → U_6Point(f) → U_7Point(f) → U_8Point(f) → U_9Point(f) → U_{10}