
Simulating a Difference of Two Means: Interactive Randomization Test
Loading the math board and drawing, please wait…
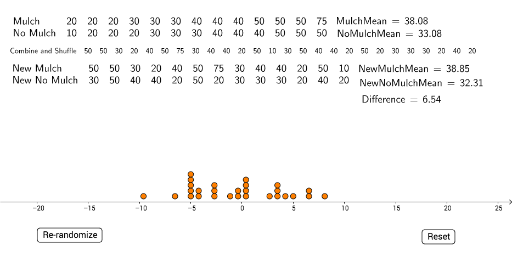
① This example demonstrates the sampling distribution of the difference between two sample means by randomly shuffling data and reassigning groups, providing an interactive visualization of a randomization (permutation) test. ② Core mathematical concepts include means, difference of means, randomization distribution, p-value approximation, and permutation-based hypothesis testing. ③ Construction highlights: uses GeoGebra commands such as TableText to display data, Shuffle to randomly permute values, Join to combine lists, Mean to compute averages, DotPlot to visualize distributions, and a button (button1) to trigger re-randomization; LaTeX text shows current mean difference and simulation results. ④ Suitable for high school or college statistics courses, AP Statistics, or introductory data analysis, this tool helps students understand sampling variability, significance testing, and the logic behind permutation tests.
GeoGebra Commands & Parameters
TableText({list1, list2}) → text1Shuffle(Join[{Mulch, NoMulch}]) → list3Join({{"Combine and Shuffle"}, list3}) → list4TableText({list4}) → text2Join({{"New Mulch"}, Take[list3, 1, 13]}) → NewMulchJoin({{"New No Mulch"}, Take[list3, 14, 26]}) → NewNoMulchTableText({NewMulch, NewNoMulch}) → text3Mean(Mulch) → MulchMeanMean(NoMulch) → NoMulchMeanLaTeX(MulchMean, true, true) → text4LaTeX(NoMulchMean, true, true) → text5Mean(Take[list3, 1, 13]) → NewMulchMeanMean(Take[list3, 14, 26]) → NewNoMulchMeanLaTeX(NewMulchMean, true, true) → text6LaTeX(NewNoMulchMean, true, true) → text7LaTeX(Difference, true, true) → text8DotPlot(data, false, 0.2) → list5
AI Drawing Prompt Reference
Create an interactive visualization for a randomization test comparing two group means. Show a table of original data on the left, and a shuffled combined dataset split into two new groups on the right. Below, display dot plots of the new group means, with text labels showing original means, new means, and the difference. Include a button to re-shuffle and update the plots and values, illustrating the sampling distribution and approximate p-value.
The prompt above was compiled from the original drawing commands and is for reference only.