
Shifts and Translations: Visualizing Function Transformations
Loading the math board and drawing, please wait…
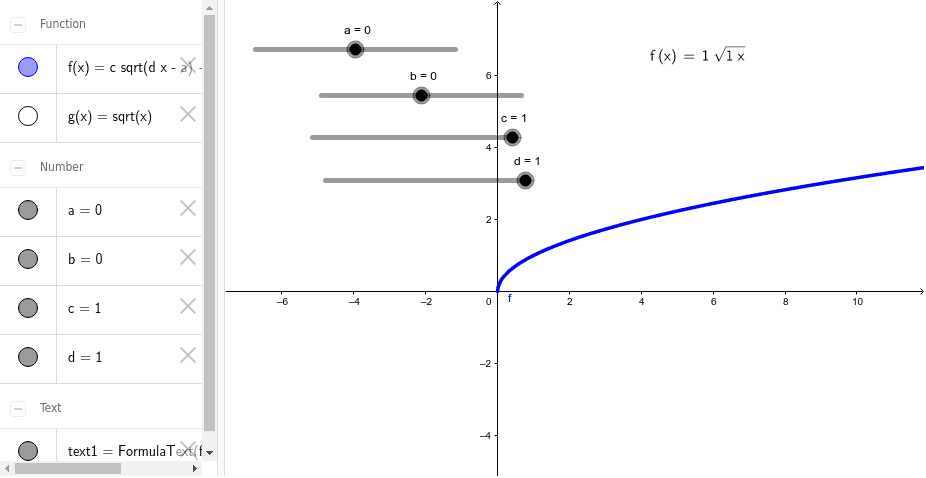
① This GeoGebra example dynamically demonstrates how function graphs shift and translate on the coordinate plane, making the positional changes before and after translation visually clear. ② Core mathematical concepts include translation transformations, function graph transformations, coordinate shifts, and the translation rules for basic functions such as quadratic functions. ③ Construction highlights: based on the construction summary, LaTeX commands are used to create text labels, and objects a, b, c, d, f, text1, and g are defined—where f and g likely represent the original and translated functions, text1 displays the translation vector or explanation, and sliders or parameters control the shift amounts for dynamic observation. ④ Suitable for middle and high school mathematics (grades 7–12) as a classroom demonstration or student exploration of function graph translations, helping learners understand how translations affect function equations.
GeoGebra Commands & Parameters
LaTeX(f, true, true) → text1