
Exponential Functions Demo by Rodolfo Fernández de Lara Hadad
Loading the math board and drawing, please wait…
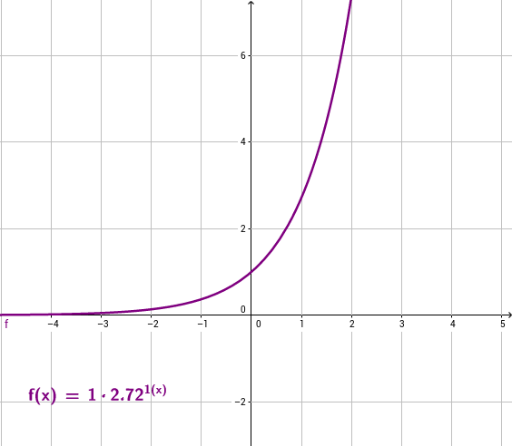
This example demonstrates the graph of exponential functions and their transformation rules. Key math concepts include the properties of exponential functions, and transformations of function graphs such as translation and scaling. Construction highlights involve using Textfield and LaTeX commands for text objects, InputBoxes for parameters a, b, c, k, h, and objects f, text1, text2 to display the function graph and parameter information. Suitable for high school mathematics teaching to visually aid students in understanding the transformation characteristics of exponential function graphs.
GeoGebra Commands & Parameters
Textfield(a) → InputBox1Textfield(b) → InputBox2Textfield(c) → InputBox3Textfield(k) → InputBox4Textfield(h) → InputBox5LaTeX(f, true, true) → text2
AI Drawing Prompt Reference
Create a demonstration graph of an exponential function with transformation controls. Show a coordinate plane with an exponential curve whose equation depends on five adjustable parameters controlling vertical stretch, horizontal stretch, vertical shift, and horizontal shift. Place five input boxes on the screen, each labeled with its corresponding parameter, allowing users to change values. Additionally, display a text object showing the current function formula in mathematical notation, updating dynamically as parameters change. The layout should be clean and educational, emphasizing how each parameter affects the curve's shape and position.
The prompt above was compiled from the original drawing commands and is for reference only.