
Limits Graph
Loading the math board and drawing, please wait…
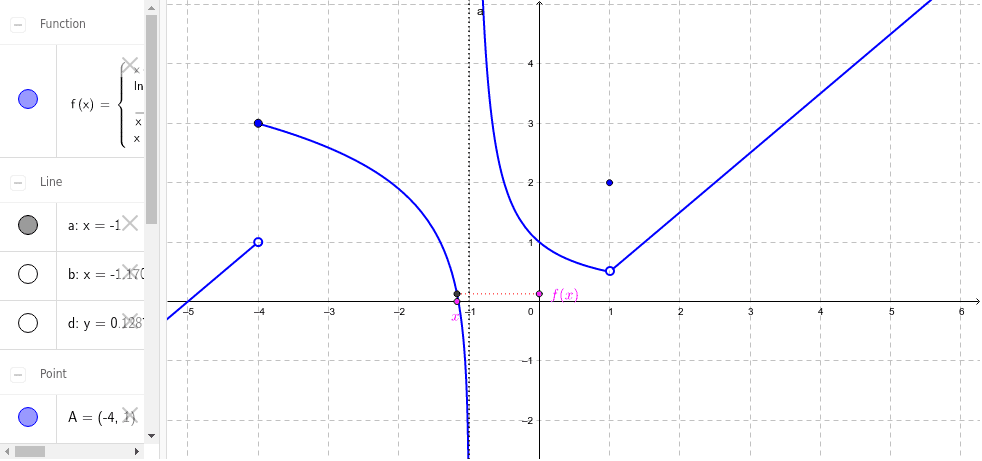
This example demonstrates the concept of limits. Through function graphs, it provides a visual understanding of the definition of limits. The construction uses commands such as Point, OrthogonalLine, Intersect, and Segment. Suitable for high school math education, helping students understand the behavior of functions at a point.
GeoGebra Commands & Parameters
Point(xAxis) → DOrthogonalLine(D, xAxis) → bIntersect(f, b, (-1.1708389502730074, 0.12870192526839208)) → ESegment(D, E) → cOrthogonalLine(E, yAxis) → dIntersect(d, yAxis) → FSegment(E, F) → e
AI Drawing Prompt Reference
Draw a graph illustrating the concept of limits for a function. Start by taking a point D on the x-axis, then draw a vertical line b through D. Next, take a point E on line b to the left of the y-axis. Connect points D and E with a line segment c. Then draw a horizontal line d through E, which intersects the y-axis at point F. Finally, connect points E and F with another line segment e.
The prompt above was compiled from the original drawing commands and is for reference only.