
Scrabble Score of Your Name: Random Shuffle and Linear Fit
Loading the math board and drawing, please wait…
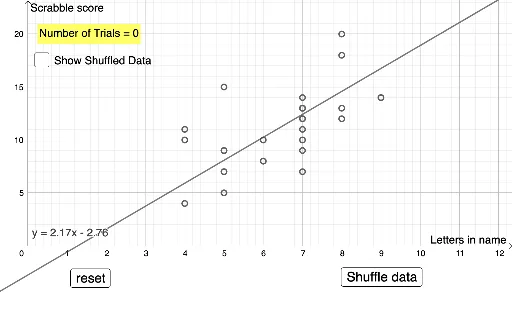
① This example converts the letters of a name into Scrabble scores and uses random shuffling to generate multiple data sets, demonstrating how to plot score versus letter position and fit a trend line. ② Core mathematical concepts include linear regression, random sampling (shuffle), data distribution, and function fitting, along with letter-frequency-to-value mapping. ③ Construction highlights: from the summary, it uses GeoGebra commands Shuffle to randomize letter sequences, FitLineY to compute the least-squares regression line, and Length to measure sequence size; objects include numerous points A1 to B21 storing position and score data for each shuffle. ④ Suitable for upper secondary or introductory university statistics courses, offering an intuitive grasp of linear regression, randomness, and data visualization, and serving as an engaging cross-disciplinary (language and math) project.
GeoGebra Commands & Parameters
Shuffle(score) → shufflescoreFitLineY(l1) → fFitLineY(l2) → gLength(data) → a
AI Drawing Prompt Reference
Create a graph showing the random shuffled Scrabble scores of a name and fit a trend line. First, convert the letters of the name into Scrabble scores, then randomly shuffle the letters to generate multiple data sets. Next, plot the relationship between scores and letter positions, and fit a line for each data set. Finally, calculate and display the length of each data set.
The prompt above was compiled from the original drawing commands and is for reference only.