
Say "RED!" Simulation — Random Color Sequence and Statistical Experiment
Loading the math board and drawing, please wait…
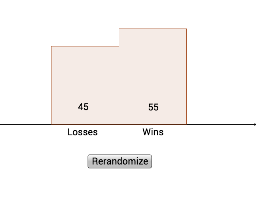
① This interactive simulation demonstrates a random experiment: clicking a button generates a sequence of red and black colors, then counts how many reds appear, mimicking the "Say RED!" game. ② Core mathematical concepts include randomness, probability distribution, counting statistics, inequalities (e.g., checking if red count exceeds a threshold), and sequence generation with shuffling. ③ Construction uses GeoGebra commands: Sequence to create lists, Join and Shuffle to randomize order, Random for random choices, If for conditional logic, HistogramRight for frequency histograms, and CountIf to count matching elements; objects include red, black, list1, list2, choice, data, win, button1, a, b, and multiple text displays. ④ Suitable for middle school or introductory probability/statistics classes, helping students visualize the link between relative frequency and theoretical probability, and serving as an example of dynamic interaction in GeoGebra.
GeoGebra Commands & Parameters
Sequence(1, n, 1, 26) → redSequence(0, n, 1, 26) → blackJoin({red, black}) → list1Shuffle(list1) → list2Random(1, 52) → choiceIf(list2(choice) ≟ 1, 1, 0) → winHistogramRight({-0.5, 0.5, 1.5}, data) → aCountIf(x > -10, data) → b