
Sampling Distribution of a Proportion Interactive Demo
Loading the math board and drawing, please wait…
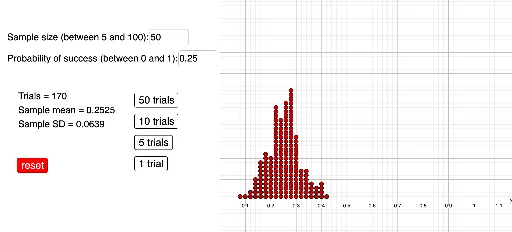
① This GeoGebra example dynamically illustrates the sampling distribution of a sample proportion using a dot plot, showing how the distribution changes with sample size n and population proportion p, and demonstrating the central limit theorem for proportions. ② Core mathematical concepts include binomial distribution, sampling distribution, standard error of a proportion, normal approximation, and statistical inference. ③ Construction details: Textfield and InputBox objects allow users to input n and p; DotPlot command generates the dot plot of sample proportions; buttons (button1 to button5) trigger simulations with different settings; l1 stores data and text1 displays summary statistics. ④ Suitable for high school or introductory college statistics courses to teach sampling distributions, the central limit theorem, and confidence intervals, either as a classroom demonstration or for student-led exploration.
GeoGebra Commands & Parameters
Textfield(n) → InputBox1Textfield(p) → InputBox2DotPlot(data, false, 0.2) → l1