
Sample Mean Distribution
Loading the math board and drawing, please wait…
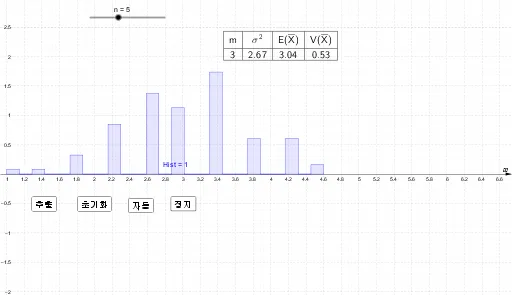
This example demonstrates the distribution of a discrete random variable, specifically the sample mean. It involves core mathematical concepts like sample mean, variance, and histogram. Constructed using commands such as Sample, mean, Length, Classes, Histogram, Variance, and TableText in GeoGebra. Suitable for high school and above, focusing on statistical distribution and data visualization.
GeoGebra Commands & Parameters
Sample(population, n, true) → samplemean(sample) → samplemeanLength(samplemeanlist) → aClasses(samplemeanlist, 25) → classesHistogram(classes, samplemeanlist, true, 1 / a) → Histmean(population) → A2mean(samplemeanlist) → C2Variance(population) → B2Variance(samplemeanlist) → D2TableText({{A1, B1, C1, D1}, {A2, B2, C2, D2}}, "|_cccc") → text3
AI Drawing Prompt Reference
Create a statistical distribution plot showing the distribution of sample means. Start by taking multiple random samples from a population, compute the mean of each sample, and collect these sample means. Then draw a histogram of these sample means, with the y-axis representing relative frequency (count divided by total number of samples) and the x-axis showing intervals of sample means. Additionally, display the population mean and variance, as well as the mean and variance of the sample means, and present these statistics in a table for comparison. The final graphic should include the histogram, labeled statistics, and a comparison table, highlighting the relationship between the sample mean distribution and population parameters.
The prompt above was compiled from the original drawing commands and is for reference only.