
Generating π from Random Numbers
Loading the math board and drawing, please wait…
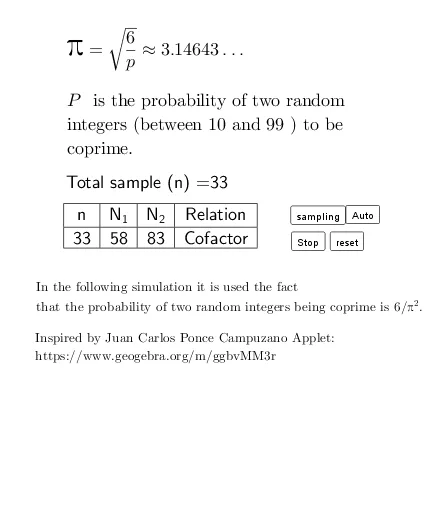
This example generates the value of π by calculating the probability of coprime pairs of random integers. It involves the concept of coprime numbers in probability and statistics. The construction uses GeoGebra commands such as Length, Sum, Frequency, Element, If, TableText, and BarChart. Suitable for high school mathematics education, particularly in probability and number theory.
GeoGebra Commands & Parameters
Length(l3) → lenSum(l3) → coprimeFrequency(l3) → l5Element(l1, t) → B2Element(l2, t) → C2If(Element[l3, t] ≟ 1, "Coprime", "Cofactor") → D2TableText({{A1, B1, C1, D1}, {A2, B2, C2, D2}}, "|_cccc") → text1BarChart(classes, l5, 0.5) → b
AI Drawing Prompt Reference
Create a statistical visualization showing the relationship between coprime probability and pi. Include a data table listing pairs of random integers with their classification as coprime or not, along with counts of coprime pairs and total pairs. Next to it, draw a bar chart with categories on the x-axis and frequencies on the y-axis, where bar heights represent the distribution of random number pairs across intervals. The layout should be clear, emphasizing probability and number theory for high school education.
The prompt above was compiled from the original drawing commands and is for reference only.