
Riemann Sum: Approximating Area Under a Curve with Rectangles
Loading the math board and drawing, please wait…
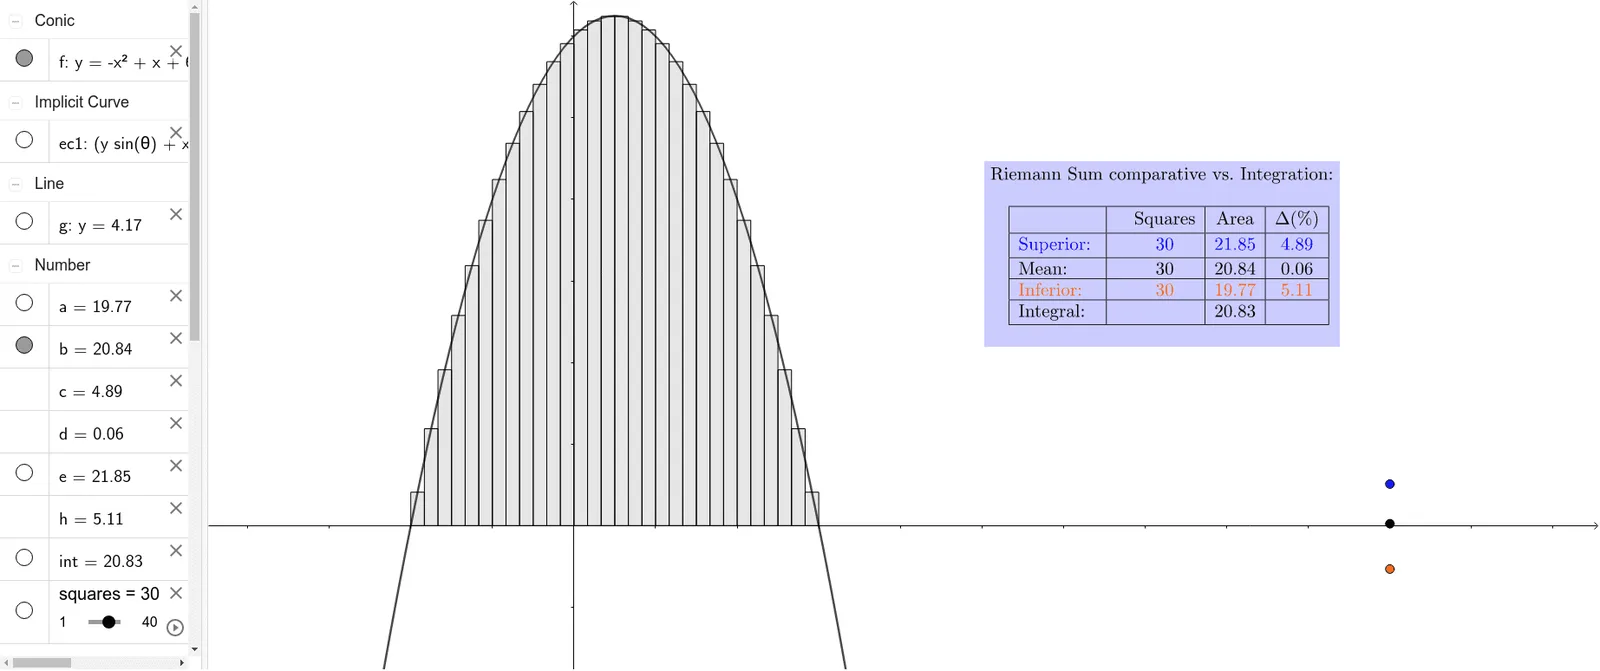
① This interactive GeoGebra example dynamically demonstrates how Riemann sums approximate the area under a function curve using rectangles, with adjustable partition counts and visual comparison of upper, lower, and exact integral values. ② Core mathematical concepts include the definition of the definite integral, upper and lower Riemann sums, the limit process of rectangular approximation, and the role of extrema in determining rectangle heights. ③ Construction highlights: the commands LowerSum and UpperSum generate lower and upper rectangle sums, RectangleSum creates a customizable rectangular approximation, Integral computes the exact area, while Intersect and Extremum locate critical points; objects such as A, B, u, f, squares, and sliders control the partition number and visualization. ④ Suitable for high school advanced calculus or introductory college calculus courses, this tool helps students grasp the geometric meaning of integration, compare approximation accuracy across different partitions, and serves as an effective classroom demonstration or self-paced exploration resource.
GeoGebra Commands & Parameters
Intersect(xAxis, yAxis) → BVector(B, A) → uLowerSum(f, -2, 3, squares) → aExtremum(f, 0, 1) → CRectangleSum(f, -2, 3, squares, 0.5) → bIntegral(f, -2, 3) → intUpperSum(f, -2, 3, squares) → e
AI Drawing Prompt Reference
Draw a function curve over the interval from -2 to 3, with adjustable rectangles approximating the area under the curve. Show two sets of rectangles: lower sums touching the curve from below and upper sums from above, with the number of rectangles controlled by a slider. Also display the exact integral area as a shaded region in a distinct color. Mark the extremum point of the function within the interval)Skip and the intersection with the axes, and include a vector arrow from the origin to a point. The rectangle heights are based on function values at subinterval endpoints, illustrating how the approximation converges to the exact area as the rectangle count increases.
The prompt above was compiled from the original drawing commands and is for reference only.