
Tank Flow Rate Modeling with Parametric Curve Visualization
Loading the math board and drawing, please wait…
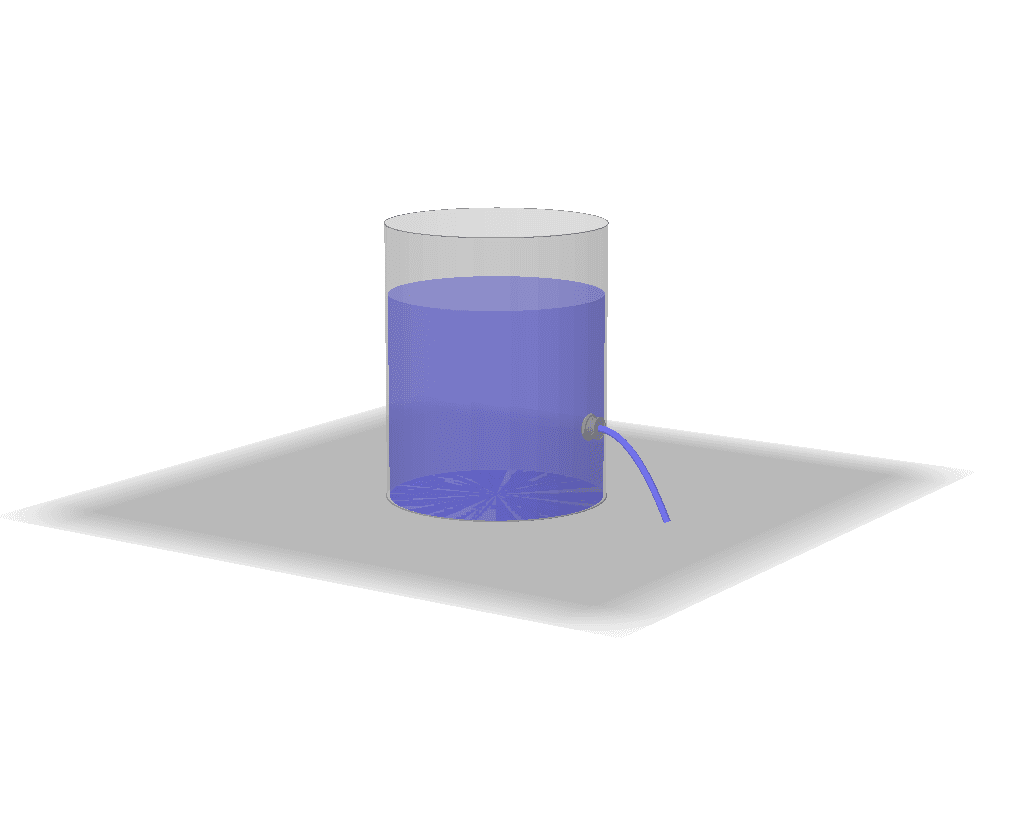
This example demonstrates how a tank’s fluid height (as a time-dependent quantity) leads to a corresponding outflow flow-rate relationship, visualized through linked geometric and graph representations. The central mathematics includes function modeling from geometry (using the volume–height relationship of a cylinder), calculus ideas that relate rate of change to flow (derivative/integration concepts underlying a differential-equation style interpretation), and graphing/parametric curve construction to express how variables vary together. Construction highlights from the provided GeoGebra summary: Cylinder is used to build a cylindrical solid from key defining points (A, B, C, D and related points a–h), while CurveCartesian creates the Cartesian curve(s) that represent the modeled relationship(s). Variables such as time and height (altura), together with auxiliary symbolic objects, connect the physical quantities to the graphical elements. Suitable for upper secondary STEM extensions on function modeling, and for introductory college calculus/differential-equation visualization to build intuition about rate-based systems.
GeoGebra Commands & Parameters
Cylinder(A, B, 2) → a, c, d, bCylinder(C, D, 0.2) → e, f, g, hCylinder(A, E, 1.95) → i, k, p, jCurveCartesian(0, ((altura - 1.5) * t) + 2.2, ((-altura) * t^(2)) + 1.5, t, 0, sqrt(1.5 / altura)) → mCurveCartesian(0, t + 2.2, (-0.5 * t^(2)) + 1.5, t, 0, sqrt(3) + 0.1) → l
AI Drawing Prompt Reference
Draw a side view of a cylindrical water tank composed of three stacked cylindrical sections: a short base cylinder, a thin top cylinder, and a taller middle section. From the tank's bottom, extend a parametric curve showing outflow rate over time as water level drops, starting high and curving downward. Add a second reference curve representing a constant baseline flow without level change. Both curves share a time-flow rate coordinate system, with the water height variable visibly affecting the curve's shape. The illustration should clearly link the tank geometry to the mathematical curves.
The prompt above was compiled from the original drawing commands and is for reference only.