
Relationship between Height and Volume of a Square-Based Pyramid
Loading the math board and drawing, please wait…
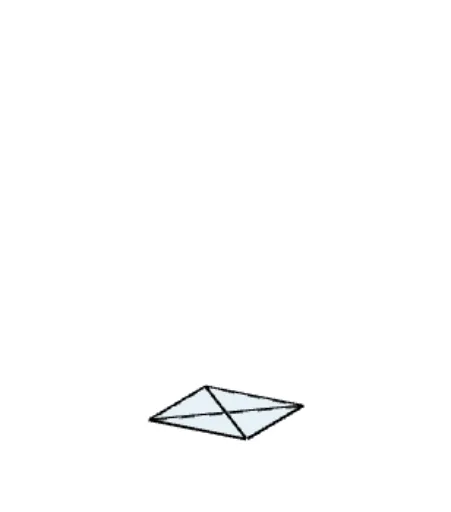
This example demonstrates the relationship between the height and volume of a square-based pyramid. Key mathematical concepts include the volume formula in solid geometry and quadratic functions. Using GeoGebra commands such as Polygon, Sequence, and Vector, the example dynamically shows how the volume of the pyramid changes with height. Suitable for high school mathematics education to help students understand the relationship between volume and height.
GeoGebra Commands & Parameters
LaTeX((((("\text{" * QUESTION) * "\\") * INSTRUCTIONS) * "}")) → TEXTPolygon({(0, 0), (0, 7), (11, 7), (11, 0)}) → viewBoxSequence(Segment[(i, -0.2), (i, 0.2)], i, 1, 10) → xTicksSequence(i, i, xInc, 10, xInc) → xTickLabelsSequence(i, i, yInc, 30, yInc) → yTickLabelsPolygon((0, 0), (0, baseLength), 4) → pyramidBaseVector((0, 0), (11, 0)) → uVector((0, 0), (0, 7)) → vSequence(Segment[(-0.2, i), (0.2, i)], i, 1, 6) → yTicksSequence(Text[Element[xTickLabels, i], (i - 0.15, -0.7)], i, 1, 10) → xAxisTickLabelsSequence((i, volumePyramid(i)), i, 0, maxHeightVisited, 0.5) → pointsToPlotSequence(Text[Element[yTickLabels, i], (-0.9, i - 0.15)], i, 1, 6) → yAxisTickLabelsZip((x(A) / xInc, y(A) / yInc), A, pointsToPlot) → pointsToPlotAdjustedCircle(currentPoint, 0.3) → currentCircleRotateText(Text["\text{Volume}", (-1.75, 5)], 90°) → yAxisLabelText("\text{Height}", (3, -1), false, true) → xAxisLabelPyramid(pyramidBase, height) → pyramid, A, face1, face3, face4, face2, edge1, edge2, edge3, edge4
AI Drawing Prompt Reference
Draw a square-based pyramid with a fixed base side length and a variable height. In a coordinate system, use the horizontal axis for height and the vertical axis for volume, plotting the curve of volume versus height. Include labeled axes with tick marks for 'Height' and 'Volume'. As the height changes, the pyramid's apex moves accordingly, and a circle marks the corresponding point on the curve, illustrating the quadratic relationship between height and volume.
The prompt above was compiled from the original drawing commands and is for reference only.