
Regression Analysis of the Leaning Tower of Pisa
Loading the math board and drawing, please wait…
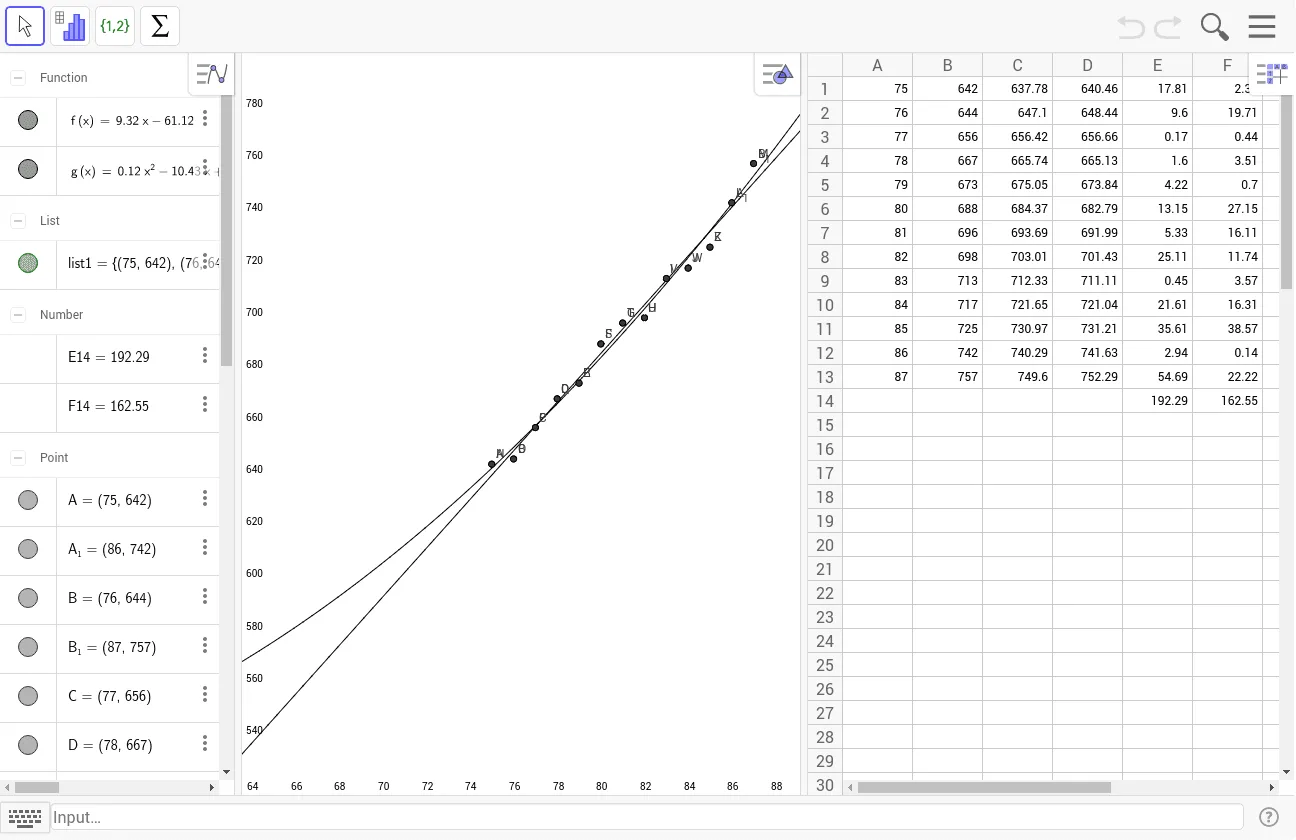
① This example demonstrates regression fitting of the Leaning Tower of Pisa’s tilt profile using measured data, showing dynamic linear and polynomial regression curves.② Core mathematical concepts: linear regression, polynomial fitting, least‑squares method, standard deviation, hypothesis testing, and calculus‑based optimization.③ Construction highlights: GeoGebra commands FitPoly and Sum are applied to point sets A1…A13, B1…B13 to obtain polynomial fits and compute residual sums of squares; the 26 data points plus auxiliary points A…N build the regression curve and confidence bands.④ Suitable for high‑school statistics electives, introductory university probability & statistics courses, and mathematical modeling or data‑analysis instruction.
GeoGebra Commands & Parameters
FitPoly(list1, 1) → fFitPoly(list1, 2) → gSum(E1:E13) → E14Sum(F1:F13) → F14