
Chi-Square Distribution Demo
Loading the math board and drawing, please wait…
In collections
Statistical Applets
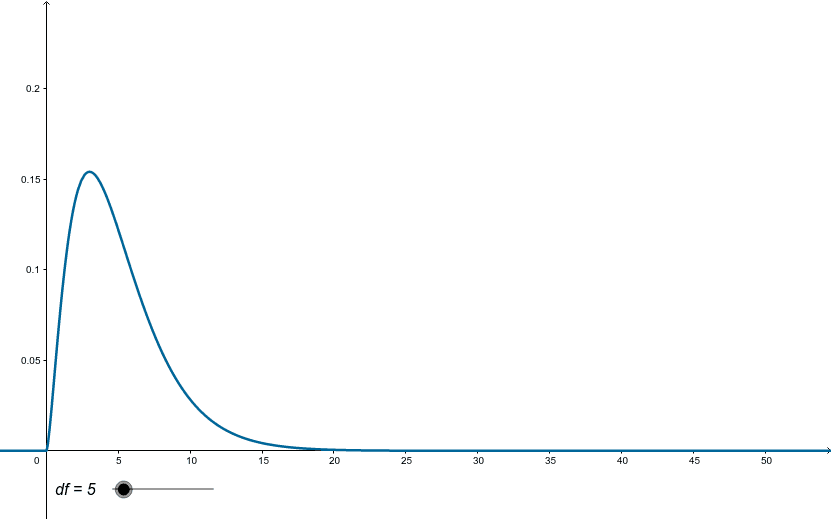
This example demonstrates how changing the degrees of freedom affects the shape of a chi-square distribution curve. Key math concepts include chi-square distribution, degrees of freedom, and probability & statistics. GeoGebra commands used are ChiSquared for plotting, OrthogonalLine for creating perpendicular lines, Intersect for finding intersections, and Segment for drawing line segments, with objects like df (degrees of freedom), f (function), text1 (displaying df value), and A, a, B, b for dynamic interaction. Suitable for high school and above students learning chi-square distribution properties in probability & statistics.
GeoGebra Commands & Parameters
ChiSquared(df, x) → fOrthogonalLine(A, xAxis) → aIntersect(a, xAxis) → BSegment(A, B) → b
AI Drawing Prompt Reference
Draw a demonstration showing how the chi-square distribution curve changes with degrees of freedom, including a chi-square distribution curve, a line perpendicular to the X-axis, the intersection point of this line with the X-axis, and a line segment connecting the foot of the perpendicular to the intersection point, with the degrees of freedom value displayed dynamically.
The prompt above was compiled from the original drawing commands and is for reference only.