
Normal Curve with Mean and SD Sliders
Loading the math board and drawing, please wait…
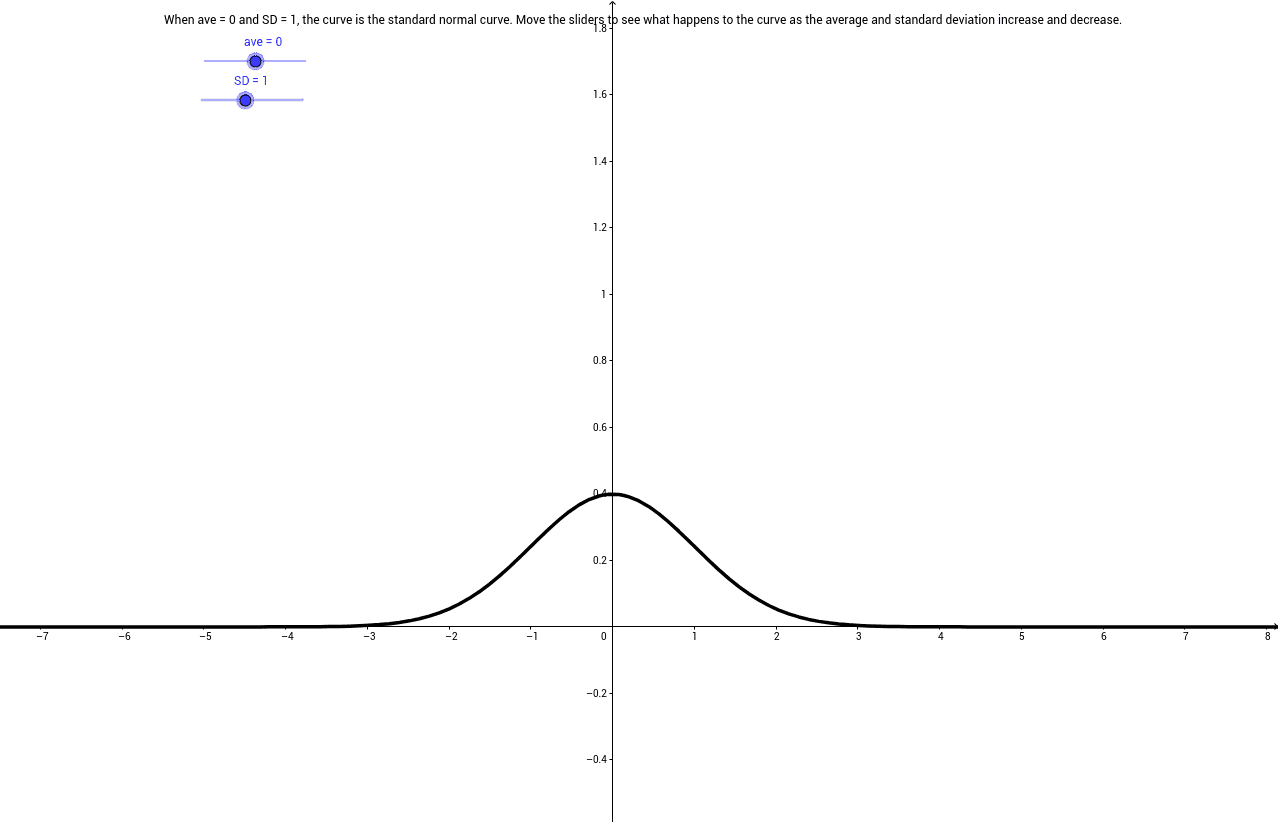
This applet demonstrates how the shape of a normal distribution curve changes as the mean (average) and standard deviation are varied via sliders. Core mathematical concepts include the normal distribution, probability density function, mean, standard deviation, and the effect of these parameters on peak height and spread. Construction highlights: GeoGebra slider objects SD and ave control the standard deviation and mean; a function f(x) = (1/(SD*sqrt(2π))) * exp(-(x-ave)^2/(2*SD^2)) is defined and graphed; a text object text1 displays the current parameter values. Suitable for high‑school probability and statistics electives, introductory university statistics courses, and classroom demonstrations or student‑led exploration.
GeoGebra Commands & Parameters
Numeric SD(1.0)Numeric ave(0.0)f(x) = 1 / (SD * sqrt(2 * π)) * ℯ^(-0.5 * ((x - ave) / SD)^(2))
AI Drawing Prompt Reference
Draw a normal distribution curve with interactive sliders for the mean and standard deviation. Include a slider to adjust the mean (average) and another slider to adjust the standard deviation. As the sliders move, dynamically plot the probability density function f(x) = 1/(SD*sqrt(2π)) * exp(-(x-ave)^2/(2*SD^2)) and show the current values of the parameters on the screen. The graph should be centered around the mean, with the spread widening or narrowing according to the standard deviation, and the curve should be smooth and clearly visible.
The prompt above was compiled from the original drawing commands and is for reference only.