
Effect of Interchanging x and y in Linear Regression
Loading the math board and drawing, please wait…
This example uses a simple dataset to illustrate that the regression line for x on y is not the inverse of the regression line for y on x. Key mathematical concepts include linear regression analysis. Using GeoGebra commands, it demonstrates how to create these graphs. Suitable for high school mathematics, particularly statistics and probability courses.
GeoGebra Commands & Parameters
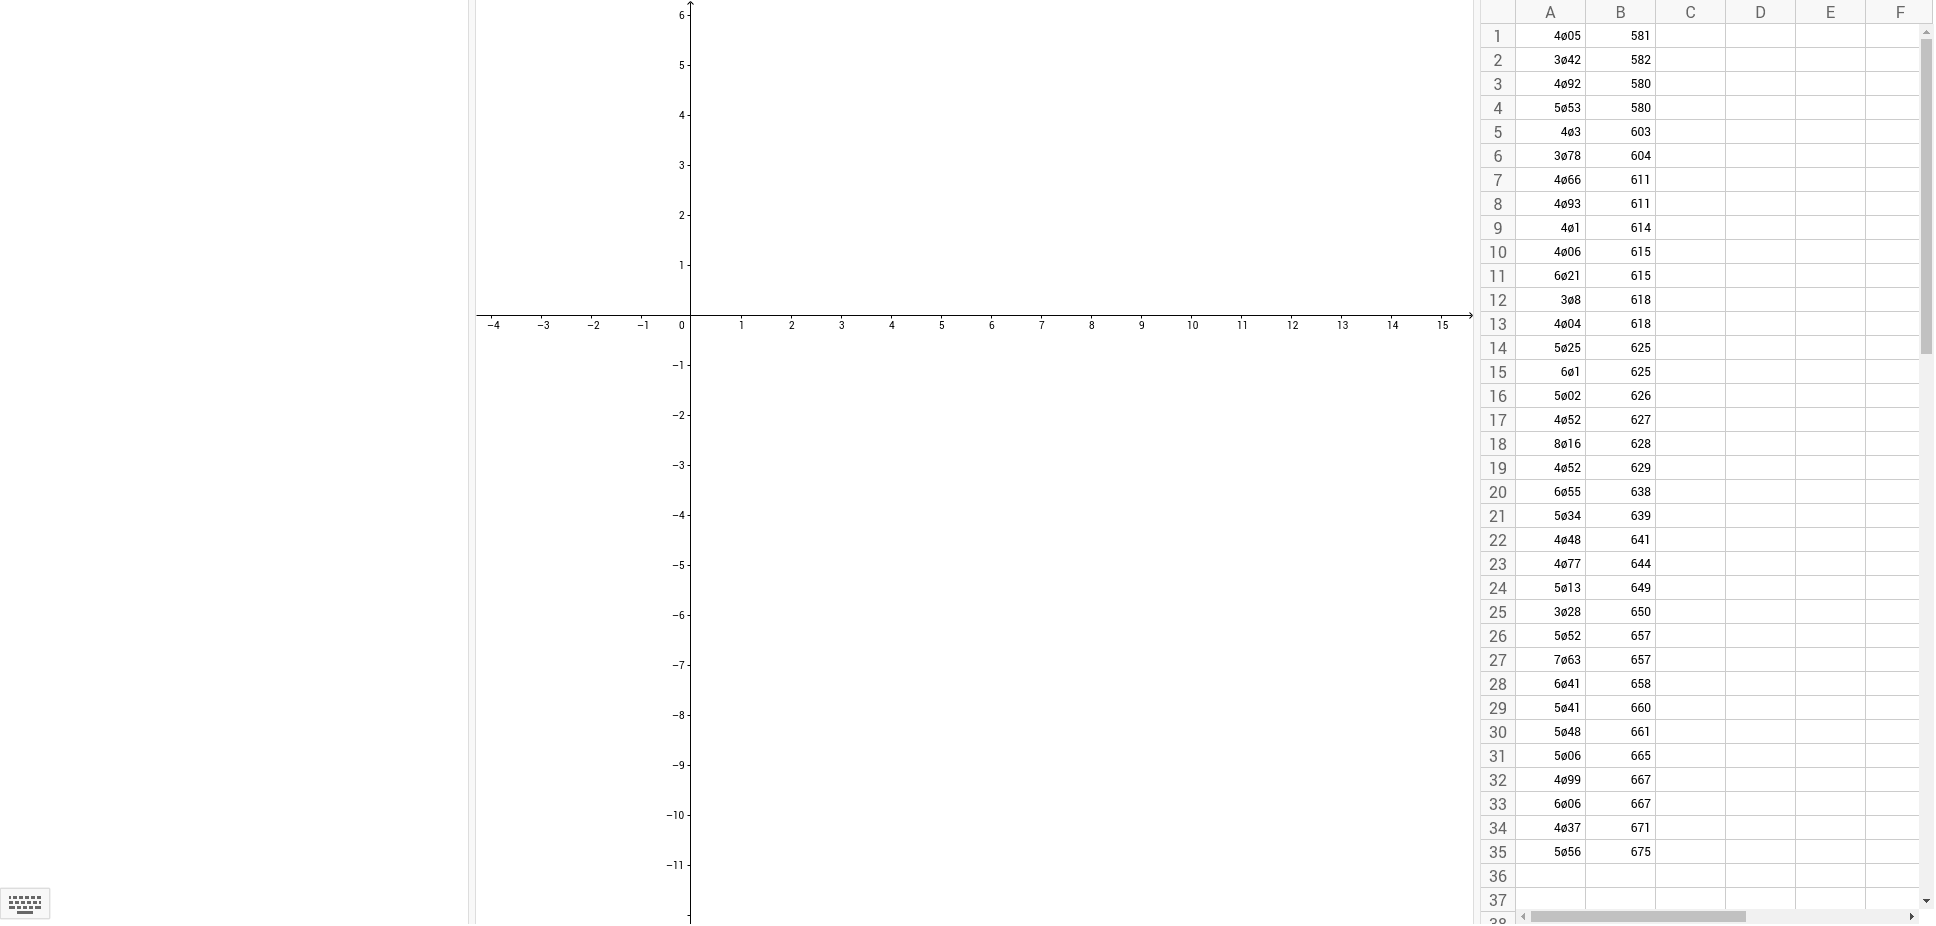
Numeric A1(4.049)Numeric B1(581.0)Numeric A2(3.423)Numeric B2(582.0)Numeric A3(4.917)Numeric B3(580.0)Numeric A4(5.532)Numeric B4(580.0)Numeric A5(4.304)Numeric B5(603.0)Numeric A6(3.777)Numeric B6(604.0)Numeric A7(4.663)Numeric B7(611.0)Numeric A8(4.934)Numeric B8(611.0)Numeric A9(4.097)Numeric B9(614.0)Numeric A10(4.06)Numeric B10(615.0)Numeric A11(6.208)Numeric B11(615.0)Numeric A12(3.8)Numeric B12(618.0)Numeric A13(4.041)Numeric B13(618.0)Numeric A14(5.247)Numeric B14(625.0)Numeric A15(6.1)Numeric B15(625.0)Numeric A16(5.02)Numeric B16(626.0)Numeric A17(4.52)Numeric B17(627.0)Numeric A18(8.162)Numeric B18(628.0)Numeric A19(4.521)Numeric B19(629.0)Numeric A20(6.554)Numeric B20(638.0)Numeric A21(5.338)Numeric B21(639.0)Numeric A22(4.483)Numeric B22(641.0)Numeric A23(4.772)Numeric B23(644.0)Numeric A24(5.128)Numeric B24(649.0)Numeric A25(3.28)Numeric B25(650.0)Numeric A26(5.515)Numeric B26(657.0)Numeric A27(7.629)Numeric B27(657.0)Numeric A28(6.413)Numeric B28(658.0)Numeric A29(5.41)Numeric B29(660.0)Numeric A30(5.477)Numeric B30(661.0)
AI Drawing Prompt Reference
Draw a scatter plot with two sets of data points, and show the linear regression lines for predicting x from y and y from x, to illustrate their relationship. Start by plotting the scatter points, then add the two regression lines with distinct colors or styles.
The prompt above was compiled from the original drawing commands and is for reference only.